Ugandan vs Immigrants from South Africa Divorced or Separated
COMPARE
Ugandan
Immigrants from South Africa
Divorced or Separated
Divorced or Separated Comparison
Ugandans
Immigrants from South Africa
11.8%
DIVORCED OR SEPARATED
93.1/ 100
METRIC RATING
124th/ 347
METRIC RANK
11.7%
DIVORCED OR SEPARATED
96.9/ 100
METRIC RATING
109th/ 347
METRIC RANK
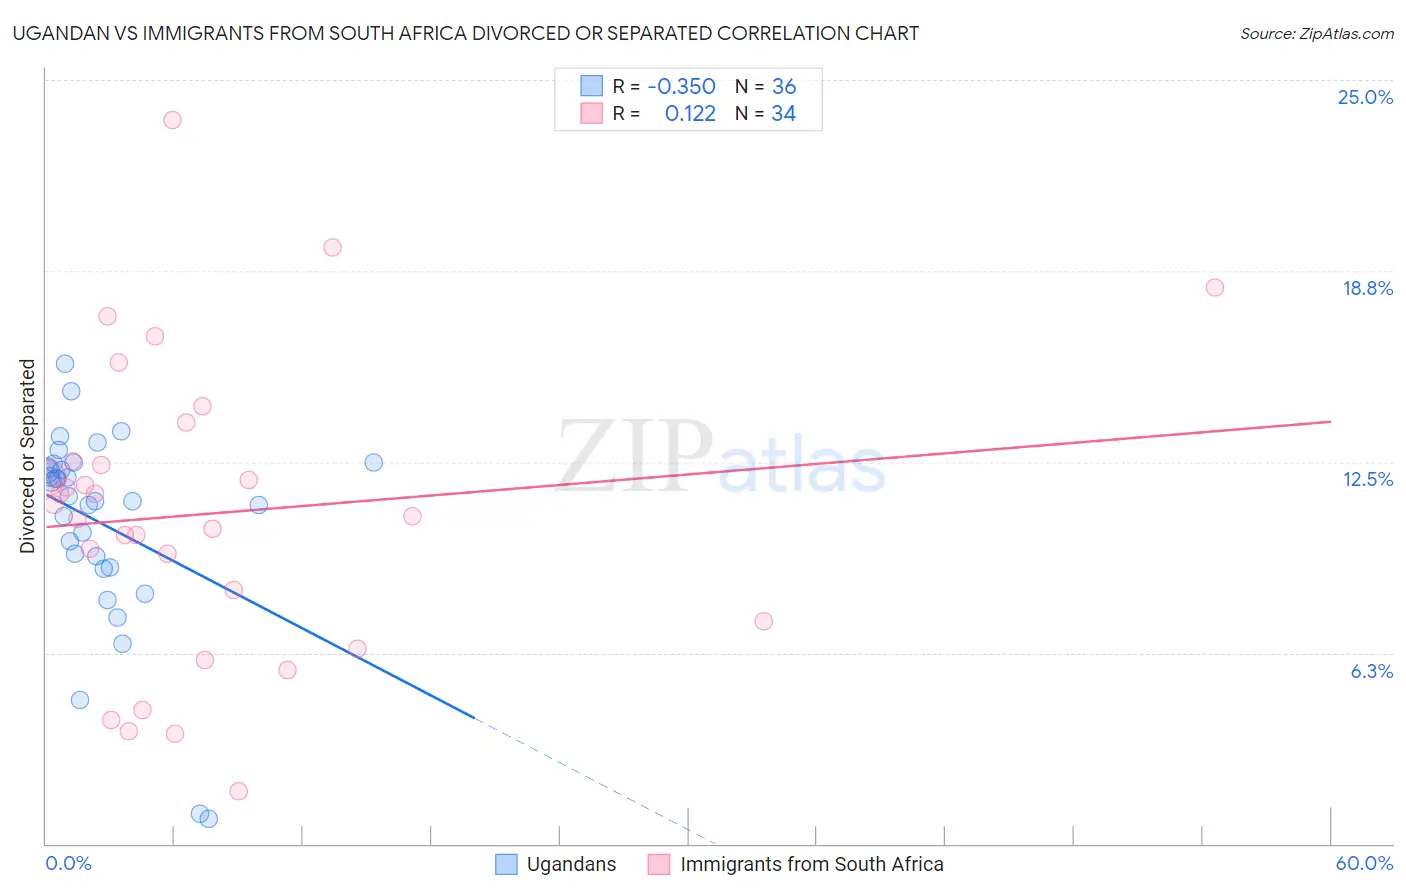
Ugandan vs Immigrants from South Africa Divorced or Separated Correlation Chart
The statistical analysis conducted on geographies consisting of 94,013,976 people shows a mild negative correlation between the proportion of Ugandans and percentage of population currently divorced or separated in the United States with a correlation coefficient (R) of -0.350 and weighted average of 11.8%. Similarly, the statistical analysis conducted on geographies consisting of 233,280,296 people shows a poor positive correlation between the proportion of Immigrants from South Africa and percentage of population currently divorced or separated in the United States with a correlation coefficient (R) of 0.122 and weighted average of 11.7%, a difference of 0.75%.
Divorced or Separated Correlation Summary
| Measurement | Ugandan | Immigrants from South Africa |
| Minimum | 0.80% | 1.7% |
| Maximum | 15.7% | 23.7% |
| Range | 14.9% | 22.0% |
| Mean | 10.5% | 10.8% |
| Median | 11.3% | 10.9% |
| Interquartile 25% (IQ1) | 9.2% | 7.3% |
| Interquartile 75% (IQ3) | 12.4% | 12.5% |
| Interquartile Range (IQR) | 3.1% | 5.2% |
| Standard Deviation (Sample) | 3.3% | 4.9% |
| Standard Deviation (Population) | 3.2% | 4.8% |
Demographics Similar to Ugandans and Immigrants from South Africa by Divorced or Separated
In terms of divorced or separated, the demographic groups most similar to Ugandans are Immigrants (11.8%, a difference of 0.080%), Menominee (11.8%, a difference of 0.090%), Ukrainian (11.8%, a difference of 0.11%), South American Indian (11.8%, a difference of 0.13%), and Romanian (11.8%, a difference of 0.21%). Similarly, the demographic groups most similar to Immigrants from South Africa are Immigrants from Czechoslovakia (11.7%, a difference of 0.0%), Greek (11.7%, a difference of 0.010%), Immigrants from Spain (11.7%, a difference of 0.040%), Immigrants from France (11.7%, a difference of 0.090%), and Estonian (11.7%, a difference of 0.090%).
| Demographics | Rating | Rank | Divorced or Separated |
| Immigrants | Kazakhstan | 97.8 /100 | #106 | Exceptional 11.7% |
| Native Hawaiians | 97.2 /100 | #107 | Exceptional 11.7% |
| Greeks | 96.9 /100 | #108 | Exceptional 11.7% |
| Immigrants | South Africa | 96.9 /100 | #109 | Exceptional 11.7% |
| Immigrants | Czechoslovakia | 96.9 /100 | #110 | Exceptional 11.7% |
| Immigrants | Spain | 96.8 /100 | #111 | Exceptional 11.7% |
| Immigrants | France | 96.6 /100 | #112 | Exceptional 11.7% |
| Estonians | 96.6 /100 | #113 | Exceptional 11.7% |
| Immigrants | Norway | 95.9 /100 | #114 | Exceptional 11.7% |
| Lithuanians | 95.7 /100 | #115 | Exceptional 11.7% |
| Immigrants | Iraq | 95.4 /100 | #116 | Exceptional 11.7% |
| Immigrants | Uganda | 95.3 /100 | #117 | Exceptional 11.7% |
| Ecuadorians | 95.3 /100 | #118 | Exceptional 11.7% |
| Syrians | 95.1 /100 | #119 | Exceptional 11.7% |
| Iraqis | 94.6 /100 | #120 | Exceptional 11.8% |
| Romanians | 94.5 /100 | #121 | Exceptional 11.8% |
| Menominee | 93.8 /100 | #122 | Exceptional 11.8% |
| Immigrants | Immigrants | 93.7 /100 | #123 | Exceptional 11.8% |
| Ugandans | 93.1 /100 | #124 | Exceptional 11.8% |
| Ukrainians | 92.3 /100 | #125 | Exceptional 11.8% |
| South American Indians | 92.1 /100 | #126 | Exceptional 11.8% |