Immigrants from China vs Pima Divorced or Separated
COMPARE
Immigrants from China
Pima
Divorced or Separated
Divorced or Separated Comparison
Immigrants from China
Pima
10.0%
DIVORCED OR SEPARATED
100.0/ 100
METRIC RATING
4th/ 347
METRIC RANK
12.9%
DIVORCED OR SEPARATED
0.0/ 100
METRIC RATING
290th/ 347
METRIC RANK
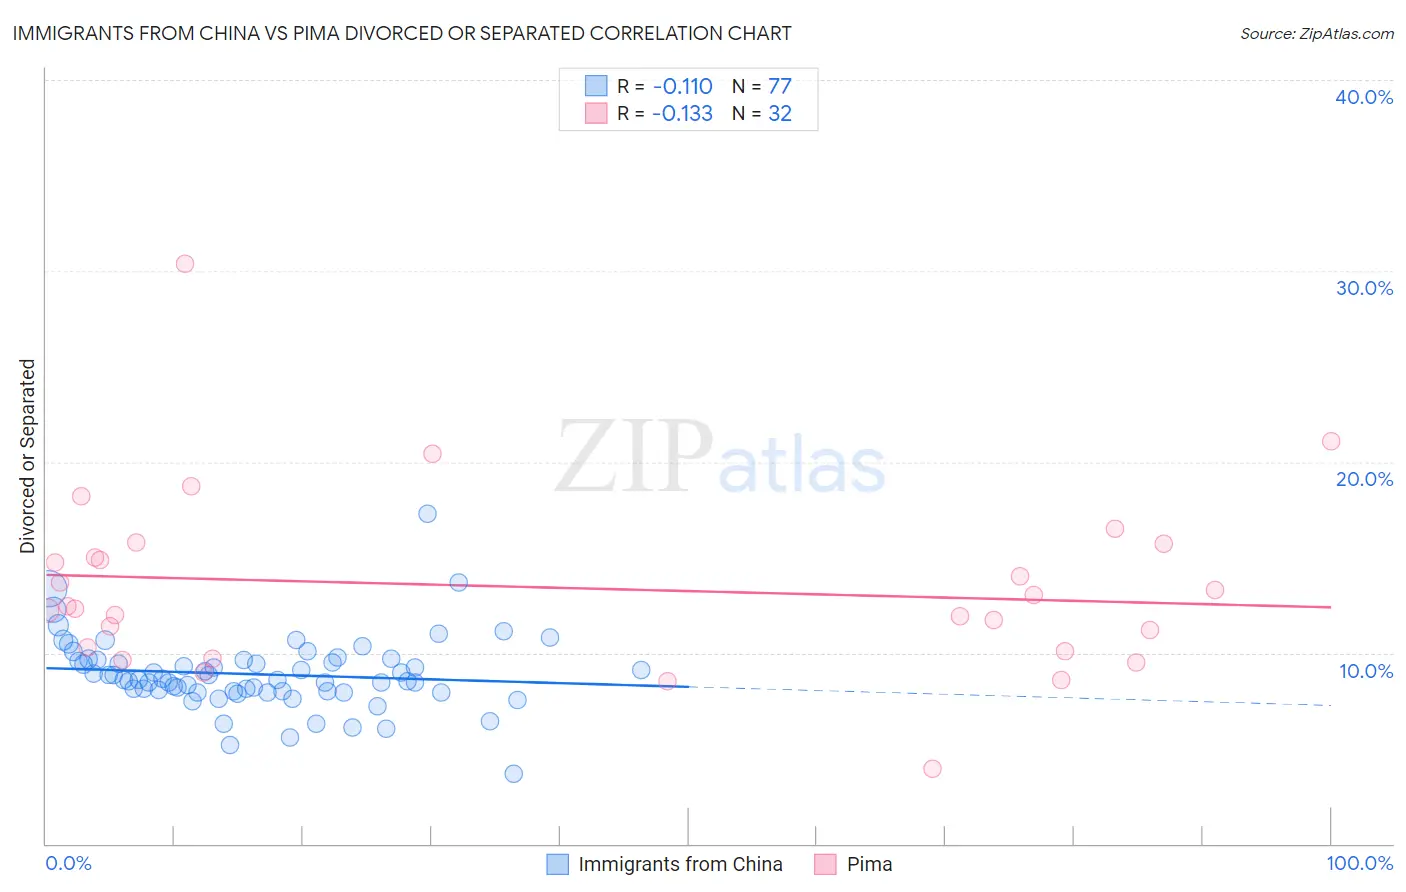
Immigrants from China vs Pima Divorced or Separated Correlation Chart
The statistical analysis conducted on geographies consisting of 456,716,224 people shows a poor negative correlation between the proportion of Immigrants from China and percentage of population currently divorced or separated in the United States with a correlation coefficient (R) of -0.110 and weighted average of 10.0%. Similarly, the statistical analysis conducted on geographies consisting of 61,551,758 people shows a poor negative correlation between the proportion of Pima and percentage of population currently divorced or separated in the United States with a correlation coefficient (R) of -0.133 and weighted average of 12.9%, a difference of 28.3%.
Divorced or Separated Correlation Summary
| Measurement | Immigrants from China | Pima |
| Minimum | 3.6% | 3.9% |
| Maximum | 17.3% | 30.4% |
| Range | 13.7% | 26.5% |
| Mean | 8.9% | 13.4% |
| Median | 8.6% | 12.4% |
| Interquartile 25% (IQ1) | 8.0% | 10.2% |
| Interquartile 75% (IQ3) | 9.6% | 15.4% |
| Interquartile Range (IQR) | 1.6% | 5.2% |
| Standard Deviation (Sample) | 1.9% | 4.8% |
| Standard Deviation (Population) | 1.9% | 4.7% |
Similar Demographics by Divorced or Separated
Demographics Similar to Immigrants from China by Divorced or Separated
In terms of divorced or separated, the demographic groups most similar to Immigrants from China are Immigrants from India (10.1%, a difference of 0.23%), Immigrants from Hong Kong (10.0%, a difference of 0.72%), Filipino (9.9%, a difference of 1.3%), Indian (Asian) (10.2%, a difference of 1.6%), and Thai (10.2%, a difference of 1.6%).
| Demographics | Rating | Rank | Divorced or Separated |
| Immigrants | Taiwan | 100.0 /100 | #1 | Exceptional 9.8% |
| Filipinos | 100.0 /100 | #2 | Exceptional 9.9% |
| Immigrants | Hong Kong | 100.0 /100 | #3 | Exceptional 10.0% |
| Immigrants | China | 100.0 /100 | #4 | Exceptional 10.0% |
| Immigrants | India | 100.0 /100 | #5 | Exceptional 10.1% |
| Indians (Asian) | 100.0 /100 | #6 | Exceptional 10.2% |
| Thais | 100.0 /100 | #7 | Exceptional 10.2% |
| Immigrants | Eastern Asia | 100.0 /100 | #8 | Exceptional 10.2% |
| Yup'ik | 100.0 /100 | #9 | Exceptional 10.3% |
| Immigrants | Singapore | 100.0 /100 | #10 | Exceptional 10.3% |
| Immigrants | South Central Asia | 100.0 /100 | #11 | Exceptional 10.4% |
| Okinawans | 100.0 /100 | #12 | Exceptional 10.5% |
| Cypriots | 100.0 /100 | #13 | Exceptional 10.5% |
| Assyrians/Chaldeans/Syriacs | 100.0 /100 | #14 | Exceptional 10.6% |
| Immigrants | Armenia | 100.0 /100 | #15 | Exceptional 10.6% |
Demographics Similar to Pima by Divorced or Separated
In terms of divorced or separated, the demographic groups most similar to Pima are Immigrants from Honduras (12.9%, a difference of 0.12%), Iroquois (12.9%, a difference of 0.14%), Scotch-Irish (12.9%, a difference of 0.17%), French Canadian (12.8%, a difference of 0.29%), and Jamaican (12.9%, a difference of 0.38%).
| Demographics | Rating | Rank | Divorced or Separated |
| Delaware | 0.1 /100 | #283 | Tragic 12.7% |
| Immigrants | Nonimmigrants | 0.1 /100 | #284 | Tragic 12.8% |
| French | 0.1 /100 | #285 | Tragic 12.8% |
| Spanish | 0.1 /100 | #286 | Tragic 12.8% |
| Hondurans | 0.1 /100 | #287 | Tragic 12.8% |
| French Canadians | 0.1 /100 | #288 | Tragic 12.8% |
| Iroquois | 0.0 /100 | #289 | Tragic 12.9% |
| Pima | 0.0 /100 | #290 | Tragic 12.9% |
| Immigrants | Honduras | 0.0 /100 | #291 | Tragic 12.9% |
| Scotch-Irish | 0.0 /100 | #292 | Tragic 12.9% |
| Jamaicans | 0.0 /100 | #293 | Tragic 12.9% |
| Apache | 0.0 /100 | #294 | Tragic 12.9% |
| Celtics | 0.0 /100 | #295 | Tragic 13.0% |
| Nicaraguans | 0.0 /100 | #296 | Tragic 13.0% |
| Natives/Alaskans | 0.0 /100 | #297 | Tragic 13.0% |