Ugandan vs Pima Median Female Earnings
COMPARE
Ugandan
Pima
Median Female Earnings
Median Female Earnings Comparison
Ugandans
Pima
$40,889
MEDIAN FEMALE EARNINGS
92.2/ 100
METRIC RATING
127th/ 347
METRIC RANK
$35,326
MEDIAN FEMALE EARNINGS
0.0/ 100
METRIC RATING
301st/ 347
METRIC RANK
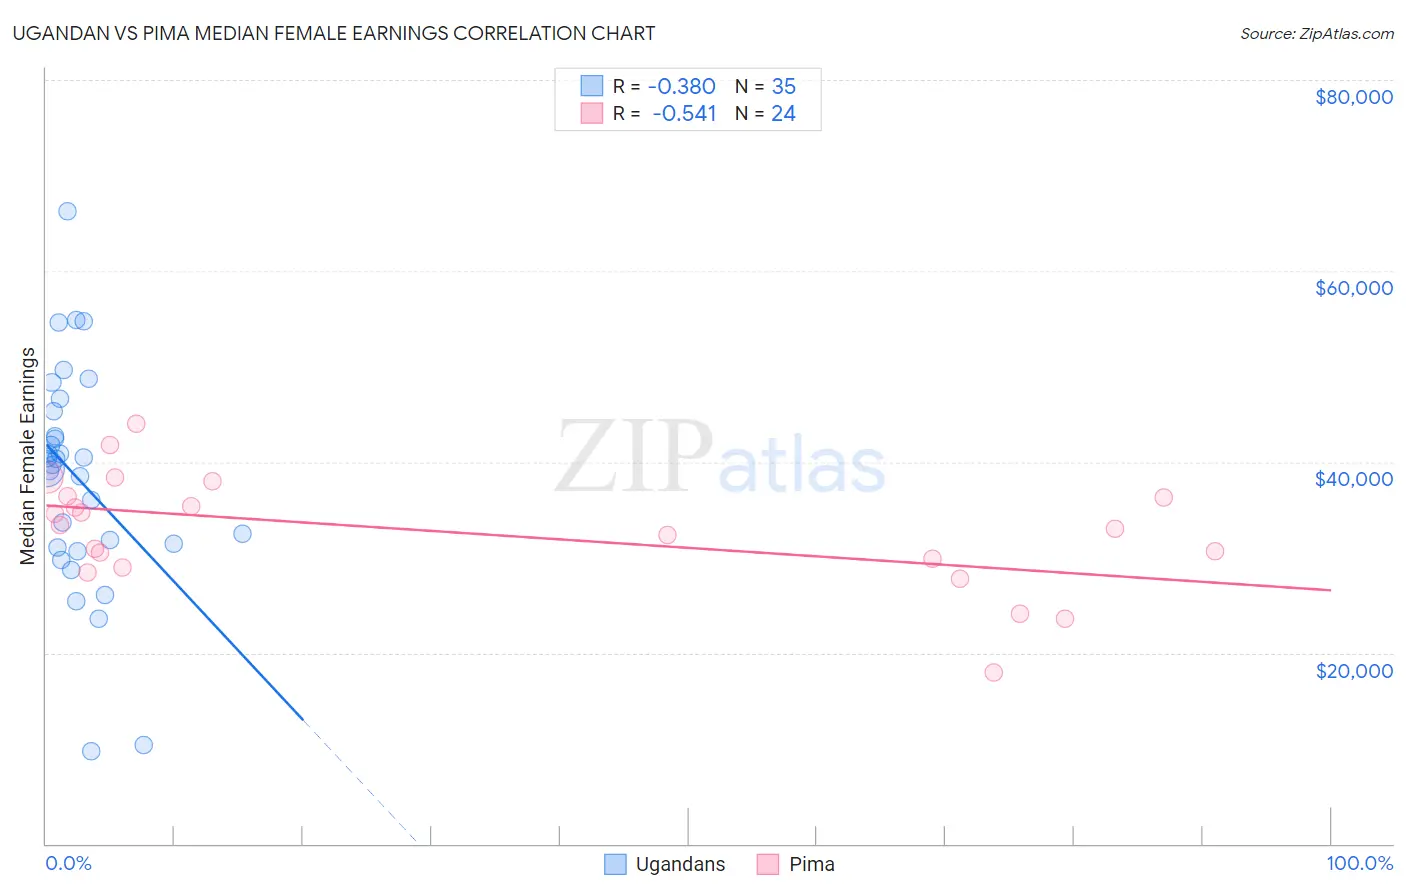
Ugandan vs Pima Median Female Earnings Correlation Chart
The statistical analysis conducted on geographies consisting of 94,007,517 people shows a mild negative correlation between the proportion of Ugandans and median female earnings in the United States with a correlation coefficient (R) of -0.380 and weighted average of $40,889. Similarly, the statistical analysis conducted on geographies consisting of 61,524,471 people shows a substantial negative correlation between the proportion of Pima and median female earnings in the United States with a correlation coefficient (R) of -0.541 and weighted average of $35,326, a difference of 15.8%.
Median Female Earnings Correlation Summary
| Measurement | Ugandan | Pima |
| Minimum | $9,732 | $17,917 |
| Maximum | $66,250 | $43,952 |
| Range | $56,518 | $26,035 |
| Mean | $38,170 | $32,676 |
| Median | $39,623 | $33,171 |
| Interquartile 25% (IQ1) | $31,024 | $29,398 |
| Interquartile 75% (IQ3) | $45,270 | $36,333 |
| Interquartile Range (IQR) | $14,246 | $6,935 |
| Standard Deviation (Sample) | $11,739 | $5,900 |
| Standard Deviation (Population) | $11,570 | $5,776 |
Similar Demographics by Median Female Earnings
Demographics Similar to Ugandans by Median Female Earnings
In terms of median female earnings, the demographic groups most similar to Ugandans are Immigrants from Trinidad and Tobago ($40,895, a difference of 0.020%), Austrian ($40,923, a difference of 0.080%), Carpatho Rusyn ($40,825, a difference of 0.16%), Trinidadian and Tobagonian ($40,958, a difference of 0.17%), and Guyanese ($40,973, a difference of 0.21%).
| Demographics | Rating | Rank | Median Female Earnings |
| Immigrants | Kuwait | 94.4 /100 | #120 | Exceptional $41,055 |
| Croatians | 93.7 /100 | #121 | Exceptional $40,993 |
| Immigrants | Jordan | 93.5 /100 | #122 | Exceptional $40,977 |
| Guyanese | 93.4 /100 | #123 | Exceptional $40,973 |
| Trinidadians and Tobagonians | 93.2 /100 | #124 | Exceptional $40,958 |
| Austrians | 92.7 /100 | #125 | Exceptional $40,923 |
| Immigrants | Trinidad and Tobago | 92.3 /100 | #126 | Exceptional $40,895 |
| Ugandans | 92.2 /100 | #127 | Exceptional $40,889 |
| Carpatho Rusyns | 91.2 /100 | #128 | Exceptional $40,825 |
| Zimbabweans | 90.8 /100 | #129 | Exceptional $40,798 |
| Immigrants | Guyana | 90.3 /100 | #130 | Exceptional $40,773 |
| Chileans | 90.0 /100 | #131 | Exceptional $40,757 |
| Immigrants | Uganda | 89.7 /100 | #132 | Excellent $40,739 |
| Syrians | 89.5 /100 | #133 | Excellent $40,727 |
| Arabs | 89.3 /100 | #134 | Excellent $40,718 |
Demographics Similar to Pima by Median Female Earnings
In terms of median female earnings, the demographic groups most similar to Pima are Black/African American ($35,315, a difference of 0.030%), Immigrants from Latin America ($35,307, a difference of 0.050%), Yuman ($35,377, a difference of 0.14%), Crow ($35,266, a difference of 0.17%), and Immigrants from Guatemala ($35,444, a difference of 0.33%).
| Demographics | Rating | Rank | Median Female Earnings |
| Cheyenne | 0.0 /100 | #294 | Tragic $35,673 |
| Comanche | 0.0 /100 | #295 | Tragic $35,661 |
| Mexican American Indians | 0.0 /100 | #296 | Tragic $35,629 |
| Hmong | 0.0 /100 | #297 | Tragic $35,498 |
| Immigrants | Micronesia | 0.0 /100 | #298 | Tragic $35,477 |
| Immigrants | Guatemala | 0.0 /100 | #299 | Tragic $35,444 |
| Yuman | 0.0 /100 | #300 | Tragic $35,377 |
| Pima | 0.0 /100 | #301 | Tragic $35,326 |
| Blacks/African Americans | 0.0 /100 | #302 | Tragic $35,315 |
| Immigrants | Latin America | 0.0 /100 | #303 | Tragic $35,307 |
| Crow | 0.0 /100 | #304 | Tragic $35,266 |
| Bahamians | 0.0 /100 | #305 | Tragic $35,125 |
| Fijians | 0.0 /100 | #306 | Tragic $35,114 |
| Sioux | 0.0 /100 | #307 | Tragic $35,063 |
| Immigrants | Bahamas | 0.0 /100 | #308 | Tragic $35,027 |