Ugandan vs Russian Divorced or Separated
COMPARE
Ugandan
Russian
Divorced or Separated
Divorced or Separated Comparison
Ugandans
Russians
11.8%
DIVORCED OR SEPARATED
93.1/ 100
METRIC RATING
124th/ 347
METRIC RANK
11.5%
DIVORCED OR SEPARATED
99.4/ 100
METRIC RATING
81st/ 347
METRIC RANK
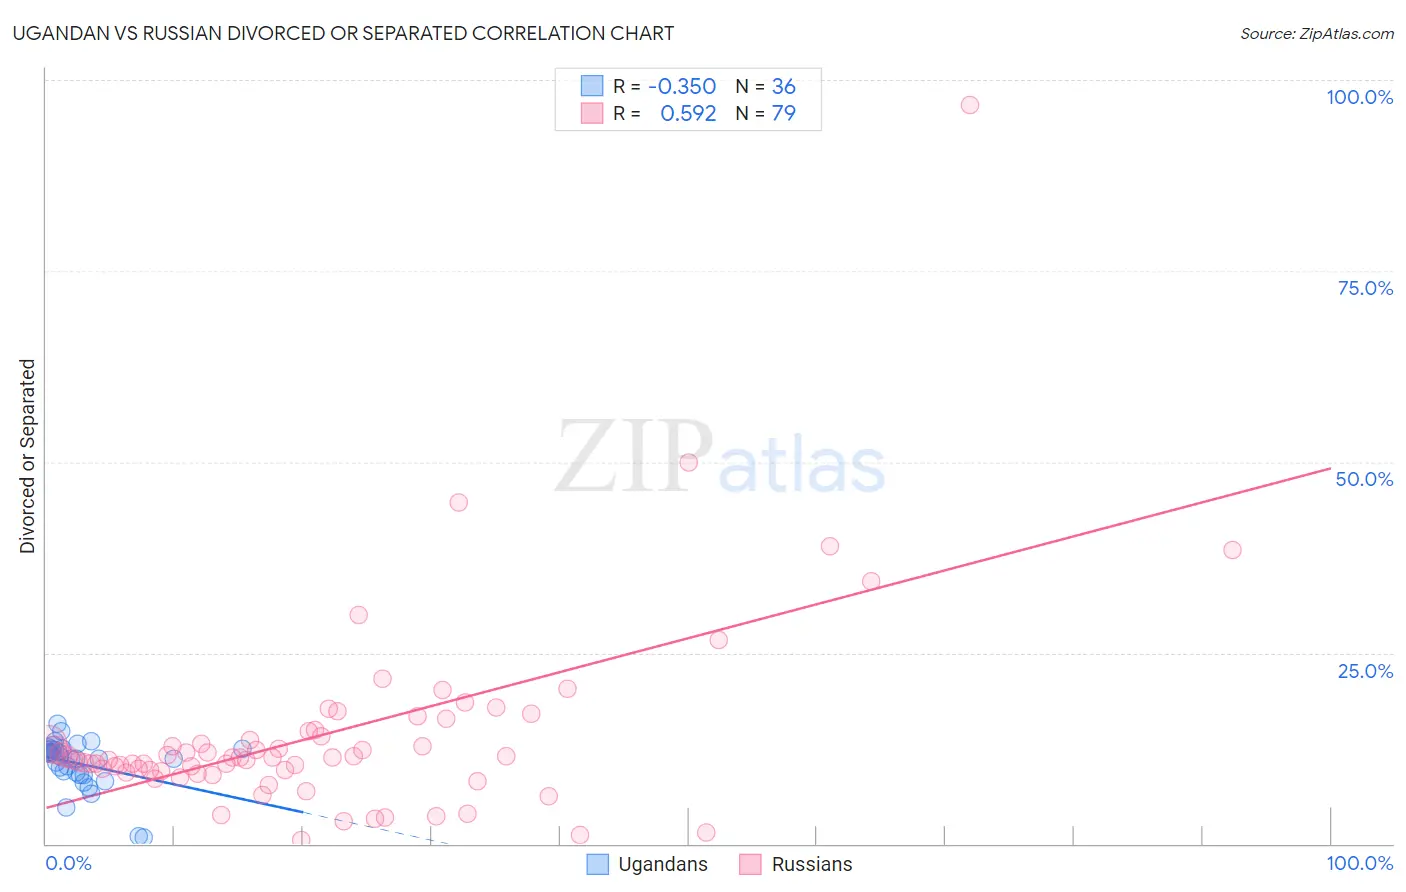
Ugandan vs Russian Divorced or Separated Correlation Chart
The statistical analysis conducted on geographies consisting of 94,013,976 people shows a mild negative correlation between the proportion of Ugandans and percentage of population currently divorced or separated in the United States with a correlation coefficient (R) of -0.350 and weighted average of 11.8%. Similarly, the statistical analysis conducted on geographies consisting of 511,901,777 people shows a substantial positive correlation between the proportion of Russians and percentage of population currently divorced or separated in the United States with a correlation coefficient (R) of 0.592 and weighted average of 11.5%, a difference of 2.3%.
Divorced or Separated Correlation Summary
| Measurement | Ugandan | Russian |
| Minimum | 0.80% | 0.50% |
| Maximum | 15.7% | 96.8% |
| Range | 14.9% | 96.3% |
| Mean | 10.5% | 14.3% |
| Median | 11.3% | 11.3% |
| Interquartile 25% (IQ1) | 9.2% | 9.6% |
| Interquartile 75% (IQ3) | 12.4% | 14.8% |
| Interquartile Range (IQR) | 3.1% | 5.2% |
| Standard Deviation (Sample) | 3.3% | 13.0% |
| Standard Deviation (Population) | 3.2% | 12.9% |
Similar Demographics by Divorced or Separated
Demographics Similar to Ugandans by Divorced or Separated
In terms of divorced or separated, the demographic groups most similar to Ugandans are Immigrants (11.8%, a difference of 0.080%), Menominee (11.8%, a difference of 0.090%), Ukrainian (11.8%, a difference of 0.11%), South American Indian (11.8%, a difference of 0.13%), and Romanian (11.8%, a difference of 0.21%).
| Demographics | Rating | Rank | Divorced or Separated |
| Immigrants | Uganda | 95.3 /100 | #117 | Exceptional 11.7% |
| Ecuadorians | 95.3 /100 | #118 | Exceptional 11.7% |
| Syrians | 95.1 /100 | #119 | Exceptional 11.7% |
| Iraqis | 94.6 /100 | #120 | Exceptional 11.8% |
| Romanians | 94.5 /100 | #121 | Exceptional 11.8% |
| Menominee | 93.8 /100 | #122 | Exceptional 11.8% |
| Immigrants | Immigrants | 93.7 /100 | #123 | Exceptional 11.8% |
| Ugandans | 93.1 /100 | #124 | Exceptional 11.8% |
| Ukrainians | 92.3 /100 | #125 | Exceptional 11.8% |
| South American Indians | 92.1 /100 | #126 | Exceptional 11.8% |
| South Africans | 88.9 /100 | #127 | Excellent 11.8% |
| Immigrants | Ecuador | 88.9 /100 | #128 | Excellent 11.8% |
| Immigrants | St. Vincent and the Grenadines | 88.4 /100 | #129 | Excellent 11.8% |
| Immigrants | Austria | 88.2 /100 | #130 | Excellent 11.8% |
| Immigrants | Cambodia | 88.2 /100 | #131 | Excellent 11.8% |
Demographics Similar to Russians by Divorced or Separated
In terms of divorced or separated, the demographic groups most similar to Russians are Immigrants from Switzerland (11.5%, a difference of 0.010%), Guyanese (11.5%, a difference of 0.030%), Afghan (11.5%, a difference of 0.070%), Immigrants from Romania (11.5%, a difference of 0.080%), and Immigrants from Bulgaria (11.5%, a difference of 0.11%).
| Demographics | Rating | Rank | Divorced or Separated |
| Taiwanese | 99.6 /100 | #74 | Exceptional 11.5% |
| Immigrants | Northern Africa | 99.6 /100 | #75 | Exceptional 11.5% |
| Albanians | 99.6 /100 | #76 | Exceptional 11.5% |
| Immigrants | Italy | 99.5 /100 | #77 | Exceptional 11.5% |
| Afghans | 99.4 /100 | #78 | Exceptional 11.5% |
| Guyanese | 99.4 /100 | #79 | Exceptional 11.5% |
| Immigrants | Switzerland | 99.4 /100 | #80 | Exceptional 11.5% |
| Russians | 99.4 /100 | #81 | Exceptional 11.5% |
| Immigrants | Romania | 99.3 /100 | #82 | Exceptional 11.5% |
| Immigrants | Bulgaria | 99.3 /100 | #83 | Exceptional 11.5% |
| Bulgarians | 99.3 /100 | #84 | Exceptional 11.5% |
| Immigrants | Albania | 99.3 /100 | #85 | Exceptional 11.5% |
| Immigrants | Latvia | 99.2 /100 | #86 | Exceptional 11.6% |
| Immigrants | Nepal | 99.2 /100 | #87 | Exceptional 11.6% |
| Immigrants | Europe | 99.2 /100 | #88 | Exceptional 11.6% |