Moroccan vs Pima Divorced or Separated
COMPARE
Moroccan
Pima
Divorced or Separated
Divorced or Separated Comparison
Moroccans
Pima
12.1%
DIVORCED OR SEPARATED
34.8/ 100
METRIC RATING
190th/ 347
METRIC RANK
12.9%
DIVORCED OR SEPARATED
0.0/ 100
METRIC RATING
290th/ 347
METRIC RANK
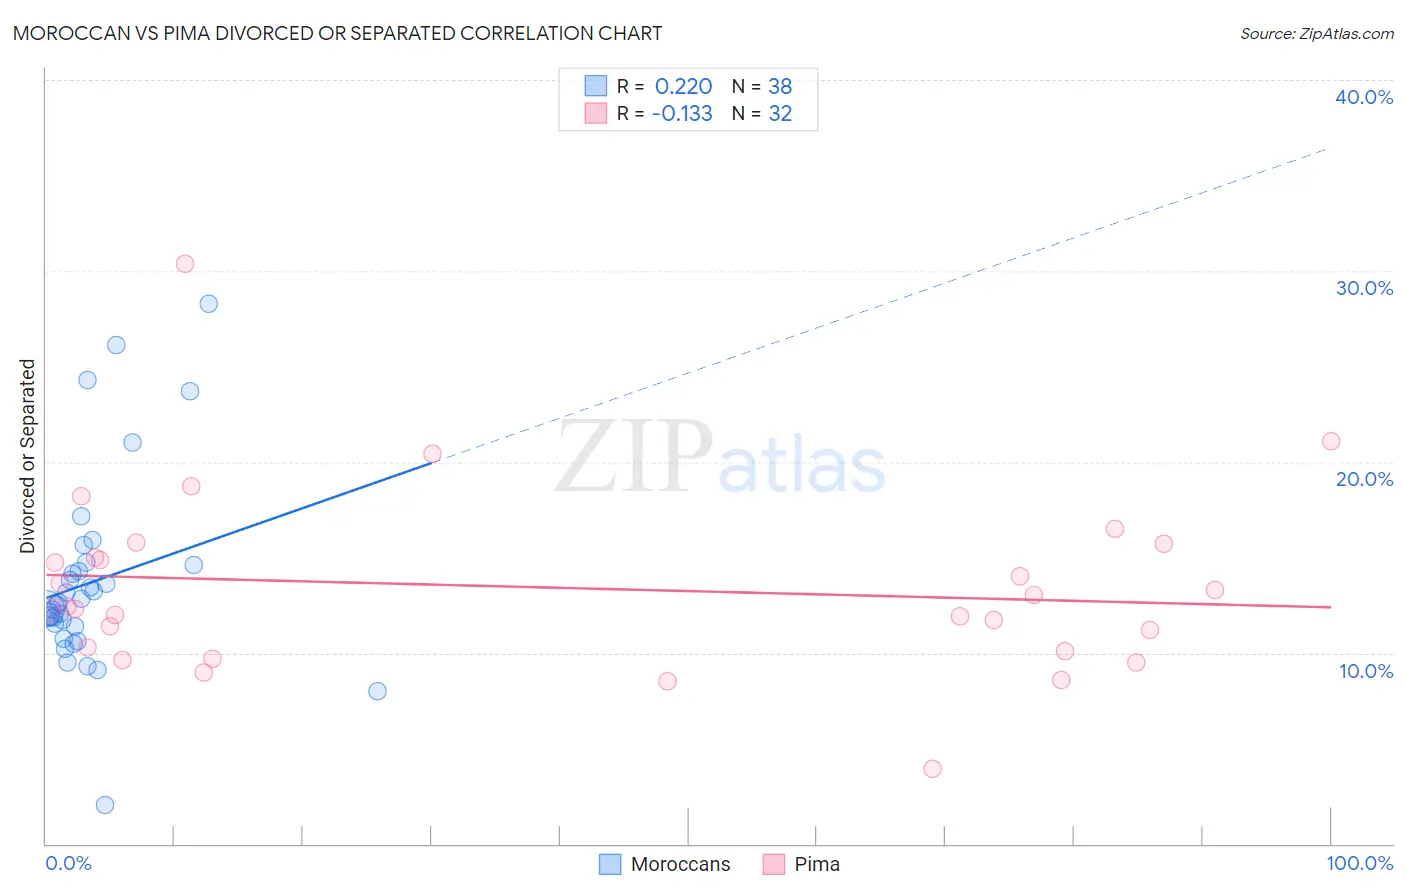
Moroccan vs Pima Divorced or Separated Correlation Chart
The statistical analysis conducted on geographies consisting of 201,776,444 people shows a weak positive correlation between the proportion of Moroccans and percentage of population currently divorced or separated in the United States with a correlation coefficient (R) of 0.220 and weighted average of 12.1%. Similarly, the statistical analysis conducted on geographies consisting of 61,551,758 people shows a poor negative correlation between the proportion of Pima and percentage of population currently divorced or separated in the United States with a correlation coefficient (R) of -0.133 and weighted average of 12.9%, a difference of 6.3%.
Divorced or Separated Correlation Summary
| Measurement | Moroccan | Pima |
| Minimum | 2.0% | 3.9% |
| Maximum | 28.3% | 30.4% |
| Range | 26.3% | 26.5% |
| Mean | 13.7% | 13.4% |
| Median | 12.6% | 12.4% |
| Interquartile 25% (IQ1) | 11.4% | 10.2% |
| Interquartile 75% (IQ3) | 14.6% | 15.4% |
| Interquartile Range (IQR) | 3.2% | 5.2% |
| Standard Deviation (Sample) | 5.1% | 4.8% |
| Standard Deviation (Population) | 5.0% | 4.7% |
Similar Demographics by Divorced or Separated
Demographics Similar to Moroccans by Divorced or Separated
In terms of divorced or separated, the demographic groups most similar to Moroccans are Swedish (12.1%, a difference of 0.020%), Sierra Leonean (12.1%, a difference of 0.030%), Norwegian (12.1%, a difference of 0.060%), Immigrants from Thailand (12.1%, a difference of 0.090%), and Immigrants from Belize (12.1%, a difference of 0.10%).
| Demographics | Rating | Rank | Divorced or Separated |
| Immigrants | Central America | 42.9 /100 | #183 | Average 12.1% |
| Immigrants | North America | 41.1 /100 | #184 | Average 12.1% |
| Immigrants | Nigeria | 40.5 /100 | #185 | Average 12.1% |
| Immigrants | Chile | 39.0 /100 | #186 | Fair 12.1% |
| Belizeans | 37.7 /100 | #187 | Fair 12.1% |
| Immigrants | Belize | 37.6 /100 | #188 | Fair 12.1% |
| Sierra Leoneans | 35.5 /100 | #189 | Fair 12.1% |
| Moroccans | 34.8 /100 | #190 | Fair 12.1% |
| Swedes | 34.4 /100 | #191 | Fair 12.1% |
| Norwegians | 33.2 /100 | #192 | Fair 12.1% |
| Immigrants | Thailand | 32.5 /100 | #193 | Fair 12.1% |
| Immigrants | Eritrea | 31.9 /100 | #194 | Fair 12.1% |
| Immigrants | England | 31.4 /100 | #195 | Fair 12.1% |
| Immigrants | Burma/Myanmar | 30.4 /100 | #196 | Fair 12.1% |
| Immigrants | Africa | 30.3 /100 | #197 | Fair 12.1% |
Demographics Similar to Pima by Divorced or Separated
In terms of divorced or separated, the demographic groups most similar to Pima are Immigrants from Honduras (12.9%, a difference of 0.12%), Iroquois (12.9%, a difference of 0.14%), Scotch-Irish (12.9%, a difference of 0.17%), French Canadian (12.8%, a difference of 0.29%), and Jamaican (12.9%, a difference of 0.38%).
| Demographics | Rating | Rank | Divorced or Separated |
| Delaware | 0.1 /100 | #283 | Tragic 12.7% |
| Immigrants | Nonimmigrants | 0.1 /100 | #284 | Tragic 12.8% |
| French | 0.1 /100 | #285 | Tragic 12.8% |
| Spanish | 0.1 /100 | #286 | Tragic 12.8% |
| Hondurans | 0.1 /100 | #287 | Tragic 12.8% |
| French Canadians | 0.1 /100 | #288 | Tragic 12.8% |
| Iroquois | 0.0 /100 | #289 | Tragic 12.9% |
| Pima | 0.0 /100 | #290 | Tragic 12.9% |
| Immigrants | Honduras | 0.0 /100 | #291 | Tragic 12.9% |
| Scotch-Irish | 0.0 /100 | #292 | Tragic 12.9% |
| Jamaicans | 0.0 /100 | #293 | Tragic 12.9% |
| Apache | 0.0 /100 | #294 | Tragic 12.9% |
| Celtics | 0.0 /100 | #295 | Tragic 13.0% |
| Nicaraguans | 0.0 /100 | #296 | Tragic 13.0% |
| Natives/Alaskans | 0.0 /100 | #297 | Tragic 13.0% |