Immigrants from England vs Pima Divorced or Separated
COMPARE
Immigrants from England
Pima
Divorced or Separated
Divorced or Separated Comparison
Immigrants from England
Pima
12.1%
DIVORCED OR SEPARATED
31.4/ 100
METRIC RATING
195th/ 347
METRIC RANK
12.9%
DIVORCED OR SEPARATED
0.0/ 100
METRIC RATING
290th/ 347
METRIC RANK
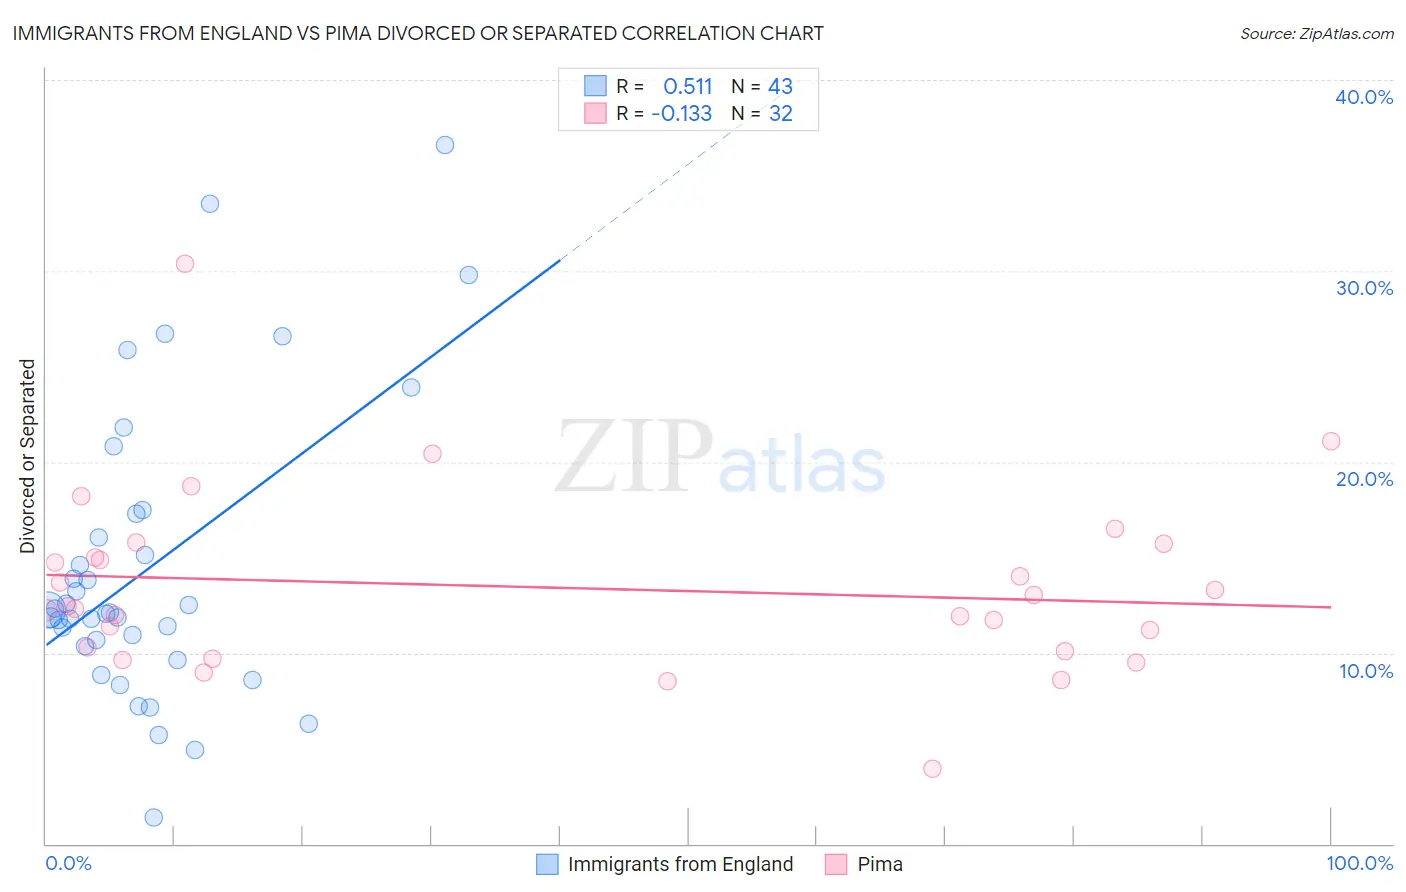
Immigrants from England vs Pima Divorced or Separated Correlation Chart
The statistical analysis conducted on geographies consisting of 391,787,172 people shows a substantial positive correlation between the proportion of Immigrants from England and percentage of population currently divorced or separated in the United States with a correlation coefficient (R) of 0.511 and weighted average of 12.1%. Similarly, the statistical analysis conducted on geographies consisting of 61,551,758 people shows a poor negative correlation between the proportion of Pima and percentage of population currently divorced or separated in the United States with a correlation coefficient (R) of -0.133 and weighted average of 12.9%, a difference of 6.1%.
Divorced or Separated Correlation Summary
| Measurement | Immigrants from England | Pima |
| Minimum | 1.4% | 3.9% |
| Maximum | 36.6% | 30.4% |
| Range | 35.2% | 26.5% |
| Mean | 14.5% | 13.4% |
| Median | 12.1% | 12.4% |
| Interquartile 25% (IQ1) | 10.4% | 10.2% |
| Interquartile 75% (IQ3) | 17.3% | 15.4% |
| Interquartile Range (IQR) | 6.9% | 5.2% |
| Standard Deviation (Sample) | 7.7% | 4.8% |
| Standard Deviation (Population) | 7.6% | 4.7% |
Similar Demographics by Divorced or Separated
Demographics Similar to Immigrants from England by Divorced or Separated
In terms of divorced or separated, the demographic groups most similar to Immigrants from England are Immigrants from Eritrea (12.1%, a difference of 0.020%), Immigrants from Thailand (12.1%, a difference of 0.040%), Immigrants from Burma/Myanmar (12.1%, a difference of 0.040%), Immigrants from Africa (12.1%, a difference of 0.040%), and Nigerian (12.1%, a difference of 0.050%).
| Demographics | Rating | Rank | Divorced or Separated |
| Immigrants | Belize | 37.6 /100 | #188 | Fair 12.1% |
| Sierra Leoneans | 35.5 /100 | #189 | Fair 12.1% |
| Moroccans | 34.8 /100 | #190 | Fair 12.1% |
| Swedes | 34.4 /100 | #191 | Fair 12.1% |
| Norwegians | 33.2 /100 | #192 | Fair 12.1% |
| Immigrants | Thailand | 32.5 /100 | #193 | Fair 12.1% |
| Immigrants | Eritrea | 31.9 /100 | #194 | Fair 12.1% |
| Immigrants | England | 31.4 /100 | #195 | Fair 12.1% |
| Immigrants | Burma/Myanmar | 30.4 /100 | #196 | Fair 12.1% |
| Immigrants | Africa | 30.3 /100 | #197 | Fair 12.1% |
| Nigerians | 30.1 /100 | #198 | Fair 12.1% |
| Central Americans | 29.4 /100 | #199 | Fair 12.1% |
| South Americans | 28.6 /100 | #200 | Fair 12.2% |
| Guatemalans | 26.9 /100 | #201 | Fair 12.2% |
| Portuguese | 23.5 /100 | #202 | Fair 12.2% |
Demographics Similar to Pima by Divorced or Separated
In terms of divorced or separated, the demographic groups most similar to Pima are Immigrants from Honduras (12.9%, a difference of 0.12%), Iroquois (12.9%, a difference of 0.14%), Scotch-Irish (12.9%, a difference of 0.17%), French Canadian (12.8%, a difference of 0.29%), and Jamaican (12.9%, a difference of 0.38%).
| Demographics | Rating | Rank | Divorced or Separated |
| Delaware | 0.1 /100 | #283 | Tragic 12.7% |
| Immigrants | Nonimmigrants | 0.1 /100 | #284 | Tragic 12.8% |
| French | 0.1 /100 | #285 | Tragic 12.8% |
| Spanish | 0.1 /100 | #286 | Tragic 12.8% |
| Hondurans | 0.1 /100 | #287 | Tragic 12.8% |
| French Canadians | 0.1 /100 | #288 | Tragic 12.8% |
| Iroquois | 0.0 /100 | #289 | Tragic 12.9% |
| Pima | 0.0 /100 | #290 | Tragic 12.9% |
| Immigrants | Honduras | 0.0 /100 | #291 | Tragic 12.9% |
| Scotch-Irish | 0.0 /100 | #292 | Tragic 12.9% |
| Jamaicans | 0.0 /100 | #293 | Tragic 12.9% |
| Apache | 0.0 /100 | #294 | Tragic 12.9% |
| Celtics | 0.0 /100 | #295 | Tragic 13.0% |
| Nicaraguans | 0.0 /100 | #296 | Tragic 13.0% |
| Natives/Alaskans | 0.0 /100 | #297 | Tragic 13.0% |