Ugandan vs Immigrants from Belize Divorced or Separated
COMPARE
Ugandan
Immigrants from Belize
Divorced or Separated
Divorced or Separated Comparison
Ugandans
Immigrants from Belize
11.8%
DIVORCED OR SEPARATED
93.1/ 100
METRIC RATING
124th/ 347
METRIC RANK
12.1%
DIVORCED OR SEPARATED
37.6/ 100
METRIC RATING
188th/ 347
METRIC RANK
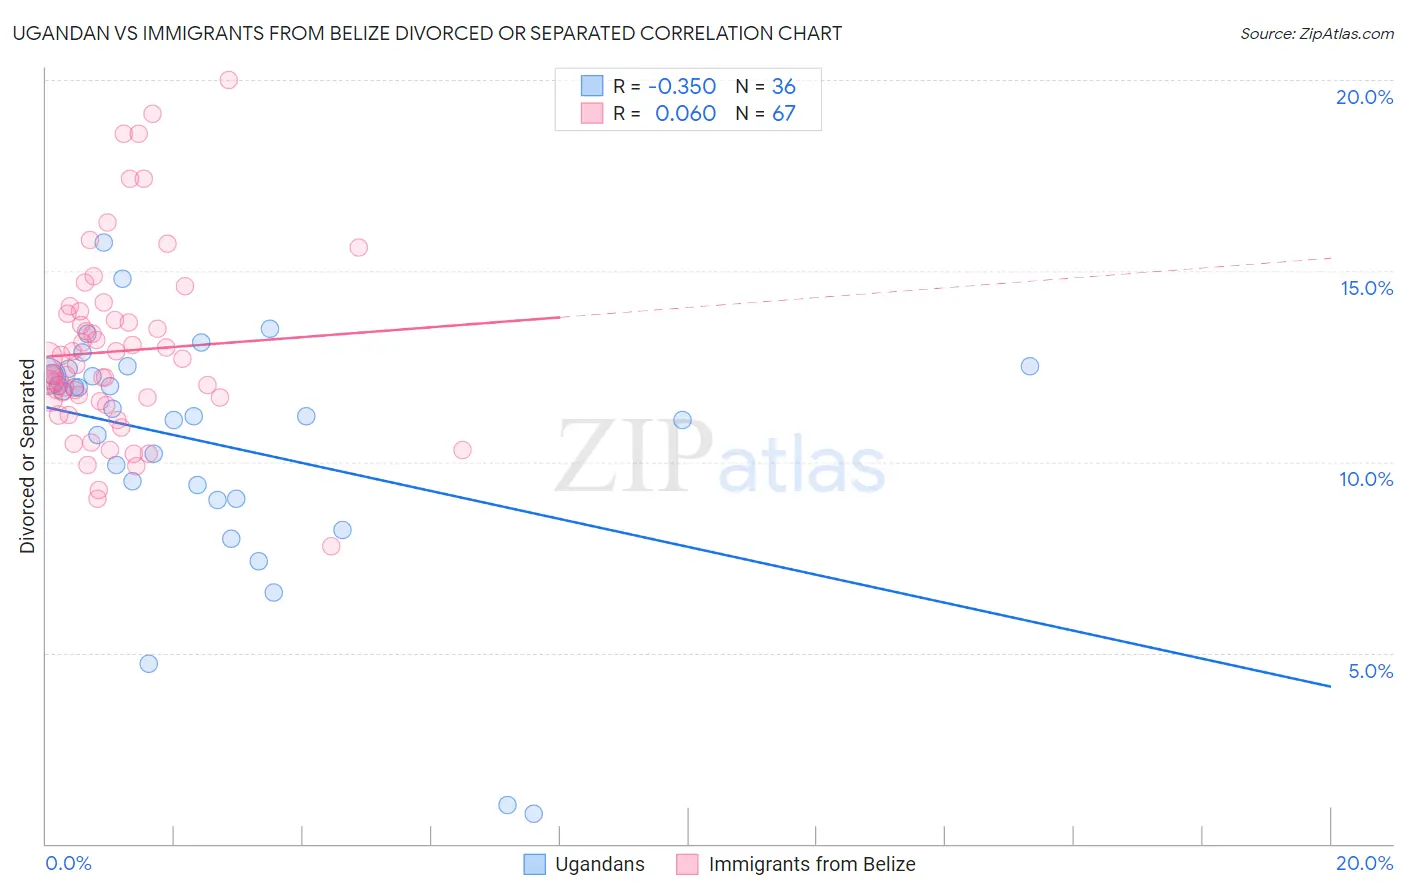
Ugandan vs Immigrants from Belize Divorced or Separated Correlation Chart
The statistical analysis conducted on geographies consisting of 94,013,976 people shows a mild negative correlation between the proportion of Ugandans and percentage of population currently divorced or separated in the United States with a correlation coefficient (R) of -0.350 and weighted average of 11.8%. Similarly, the statistical analysis conducted on geographies consisting of 130,317,505 people shows a slight positive correlation between the proportion of Immigrants from Belize and percentage of population currently divorced or separated in the United States with a correlation coefficient (R) of 0.060 and weighted average of 12.1%, a difference of 2.8%.
Divorced or Separated Correlation Summary
| Measurement | Ugandan | Immigrants from Belize |
| Minimum | 0.80% | 7.8% |
| Maximum | 15.7% | 20.0% |
| Range | 14.9% | 12.2% |
| Mean | 10.5% | 12.9% |
| Median | 11.3% | 12.3% |
| Interquartile 25% (IQ1) | 9.2% | 11.6% |
| Interquartile 75% (IQ3) | 12.4% | 13.9% |
| Interquartile Range (IQR) | 3.1% | 2.3% |
| Standard Deviation (Sample) | 3.3% | 2.4% |
| Standard Deviation (Population) | 3.2% | 2.4% |
Similar Demographics by Divorced or Separated
Demographics Similar to Ugandans by Divorced or Separated
In terms of divorced or separated, the demographic groups most similar to Ugandans are Immigrants (11.8%, a difference of 0.080%), Menominee (11.8%, a difference of 0.090%), Ukrainian (11.8%, a difference of 0.11%), South American Indian (11.8%, a difference of 0.13%), and Romanian (11.8%, a difference of 0.21%).
| Demographics | Rating | Rank | Divorced or Separated |
| Immigrants | Uganda | 95.3 /100 | #117 | Exceptional 11.7% |
| Ecuadorians | 95.3 /100 | #118 | Exceptional 11.7% |
| Syrians | 95.1 /100 | #119 | Exceptional 11.7% |
| Iraqis | 94.6 /100 | #120 | Exceptional 11.8% |
| Romanians | 94.5 /100 | #121 | Exceptional 11.8% |
| Menominee | 93.8 /100 | #122 | Exceptional 11.8% |
| Immigrants | Immigrants | 93.7 /100 | #123 | Exceptional 11.8% |
| Ugandans | 93.1 /100 | #124 | Exceptional 11.8% |
| Ukrainians | 92.3 /100 | #125 | Exceptional 11.8% |
| South American Indians | 92.1 /100 | #126 | Exceptional 11.8% |
| South Africans | 88.9 /100 | #127 | Excellent 11.8% |
| Immigrants | Ecuador | 88.9 /100 | #128 | Excellent 11.8% |
| Immigrants | St. Vincent and the Grenadines | 88.4 /100 | #129 | Excellent 11.8% |
| Immigrants | Austria | 88.2 /100 | #130 | Excellent 11.8% |
| Immigrants | Cambodia | 88.2 /100 | #131 | Excellent 11.8% |
Demographics Similar to Immigrants from Belize by Divorced or Separated
In terms of divorced or separated, the demographic groups most similar to Immigrants from Belize are Belizean (12.1%, a difference of 0.0%), Immigrants from Chile (12.1%, a difference of 0.050%), Sierra Leonean (12.1%, a difference of 0.080%), Moroccan (12.1%, a difference of 0.10%), and Immigrants from Nigeria (12.1%, a difference of 0.11%).
| Demographics | Rating | Rank | Divorced or Separated |
| Immigrants | Canada | 44.0 /100 | #181 | Average 12.1% |
| Immigrants | Ethiopia | 43.1 /100 | #182 | Average 12.1% |
| Immigrants | Central America | 42.9 /100 | #183 | Average 12.1% |
| Immigrants | North America | 41.1 /100 | #184 | Average 12.1% |
| Immigrants | Nigeria | 40.5 /100 | #185 | Average 12.1% |
| Immigrants | Chile | 39.0 /100 | #186 | Fair 12.1% |
| Belizeans | 37.7 /100 | #187 | Fair 12.1% |
| Immigrants | Belize | 37.6 /100 | #188 | Fair 12.1% |
| Sierra Leoneans | 35.5 /100 | #189 | Fair 12.1% |
| Moroccans | 34.8 /100 | #190 | Fair 12.1% |
| Swedes | 34.4 /100 | #191 | Fair 12.1% |
| Norwegians | 33.2 /100 | #192 | Fair 12.1% |
| Immigrants | Thailand | 32.5 /100 | #193 | Fair 12.1% |
| Immigrants | Eritrea | 31.9 /100 | #194 | Fair 12.1% |
| Immigrants | England | 31.4 /100 | #195 | Fair 12.1% |