Tsimshian vs Hungarian Currently Married
COMPARE
Tsimshian
Hungarian
Currently Married
Currently Married Comparison
Tsimshian
Hungarians
47.7%
CURRENTLY MARRIED
92.4/ 100
METRIC RATING
108th/ 347
METRIC RANK
48.8%
CURRENTLY MARRIED
99.4/ 100
METRIC RATING
37th/ 347
METRIC RANK
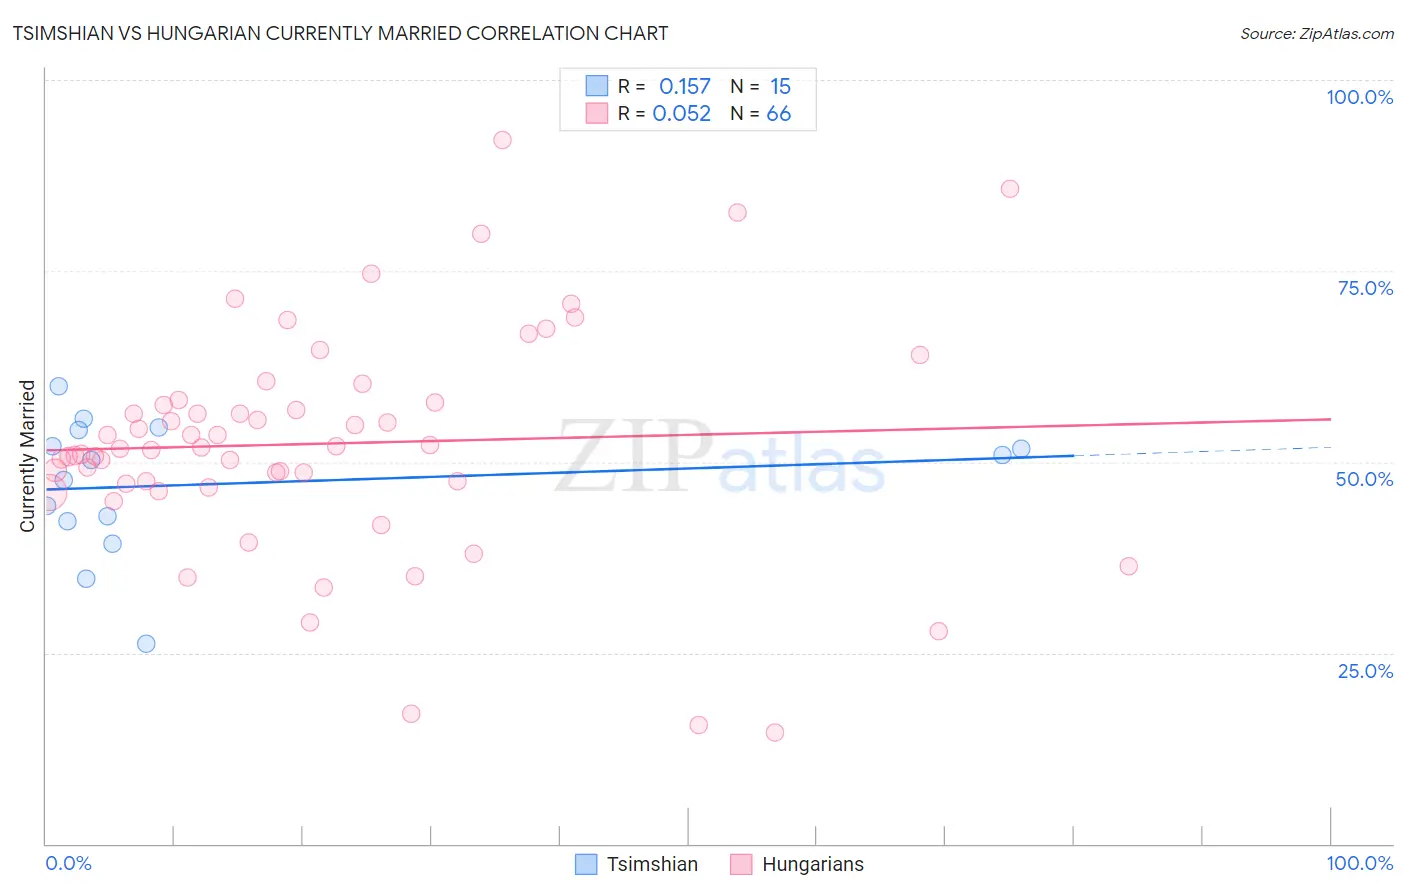
Tsimshian vs Hungarian Currently Married Correlation Chart
The statistical analysis conducted on geographies consisting of 15,626,544 people shows a poor positive correlation between the proportion of Tsimshian and percentage of population currently married in the United States with a correlation coefficient (R) of 0.157 and weighted average of 47.7%. Similarly, the statistical analysis conducted on geographies consisting of 486,182,197 people shows a slight positive correlation between the proportion of Hungarians and percentage of population currently married in the United States with a correlation coefficient (R) of 0.052 and weighted average of 48.8%, a difference of 2.4%.
Currently Married Correlation Summary
| Measurement | Tsimshian | Hungarian |
| Minimum | 26.2% | 14.5% |
| Maximum | 60.0% | 92.1% |
| Range | 33.8% | 77.6% |
| Mean | 47.1% | 52.4% |
| Median | 50.2% | 51.8% |
| Interquartile 25% (IQ1) | 42.2% | 47.1% |
| Interquartile 75% (IQ3) | 54.2% | 57.7% |
| Interquartile Range (IQR) | 12.0% | 10.6% |
| Standard Deviation (Sample) | 8.9% | 14.9% |
| Standard Deviation (Population) | 8.6% | 14.7% |
Similar Demographics by Currently Married
Demographics Similar to Tsimshian by Currently Married
In terms of currently married, the demographic groups most similar to Tsimshian are Immigrants from Egypt (47.7%, a difference of 0.010%), Immigrants from Russia (47.7%, a difference of 0.050%), Immigrants from Italy (47.7%, a difference of 0.060%), Immigrants from Greece (47.7%, a difference of 0.090%), and Immigrants from Singapore (47.8%, a difference of 0.12%).
| Demographics | Rating | Rank | Currently Married |
| Immigrants | Germany | 94.1 /100 | #101 | Exceptional 47.8% |
| Turks | 93.9 /100 | #102 | Exceptional 47.8% |
| Cypriots | 93.7 /100 | #103 | Exceptional 47.8% |
| Serbians | 93.6 /100 | #104 | Exceptional 47.8% |
| Immigrants | Singapore | 93.3 /100 | #105 | Exceptional 47.8% |
| Immigrants | Greece | 93.1 /100 | #106 | Exceptional 47.7% |
| Immigrants | Italy | 92.9 /100 | #107 | Exceptional 47.7% |
| Tsimshian | 92.4 /100 | #108 | Exceptional 47.7% |
| Immigrants | Egypt | 92.3 /100 | #109 | Exceptional 47.7% |
| Immigrants | Russia | 92.0 /100 | #110 | Exceptional 47.7% |
| Immigrants | Hungary | 91.2 /100 | #111 | Exceptional 47.6% |
| Immigrants | Western Europe | 91.1 /100 | #112 | Exceptional 47.6% |
| Immigrants | Denmark | 90.9 /100 | #113 | Exceptional 47.6% |
| South Africans | 90.5 /100 | #114 | Exceptional 47.6% |
| Immigrants | Indonesia | 90.5 /100 | #115 | Exceptional 47.6% |
Demographics Similar to Hungarians by Currently Married
In terms of currently married, the demographic groups most similar to Hungarians are Italian (48.8%, a difference of 0.0%), Immigrants from Northern Europe (48.8%, a difference of 0.010%), Immigrants from Lithuania (48.8%, a difference of 0.030%), Czechoslovakian (48.8%, a difference of 0.040%), and British (48.8%, a difference of 0.070%).
| Demographics | Rating | Rank | Currently Married |
| Eastern Europeans | 99.5 /100 | #30 | Exceptional 48.9% |
| Poles | 99.5 /100 | #31 | Exceptional 48.9% |
| Immigrants | Hong Kong | 99.5 /100 | #32 | Exceptional 48.9% |
| Irish | 99.5 /100 | #33 | Exceptional 48.9% |
| Immigrants | Lithuania | 99.4 /100 | #34 | Exceptional 48.8% |
| Immigrants | Northern Europe | 99.4 /100 | #35 | Exceptional 48.8% |
| Italians | 99.4 /100 | #36 | Exceptional 48.8% |
| Hungarians | 99.4 /100 | #37 | Exceptional 48.8% |
| Czechoslovakians | 99.4 /100 | #38 | Exceptional 48.8% |
| British | 99.4 /100 | #39 | Exceptional 48.8% |
| Immigrants | Canada | 99.4 /100 | #40 | Exceptional 48.8% |
| Greeks | 99.3 /100 | #41 | Exceptional 48.8% |
| Finns | 99.3 /100 | #42 | Exceptional 48.8% |
| Scotch-Irish | 99.3 /100 | #43 | Exceptional 48.7% |
| Immigrants | North America | 99.3 /100 | #44 | Exceptional 48.7% |