Tsimshian vs Immigrants from Turkey Currently Married
COMPARE
Tsimshian
Immigrants from Turkey
Currently Married
Currently Married Comparison
Tsimshian
Immigrants from Turkey
47.7%
CURRENTLY MARRIED
92.4/ 100
METRIC RATING
108th/ 347
METRIC RANK
47.0%
CURRENTLY MARRIED
70.0/ 100
METRIC RATING
150th/ 347
METRIC RANK
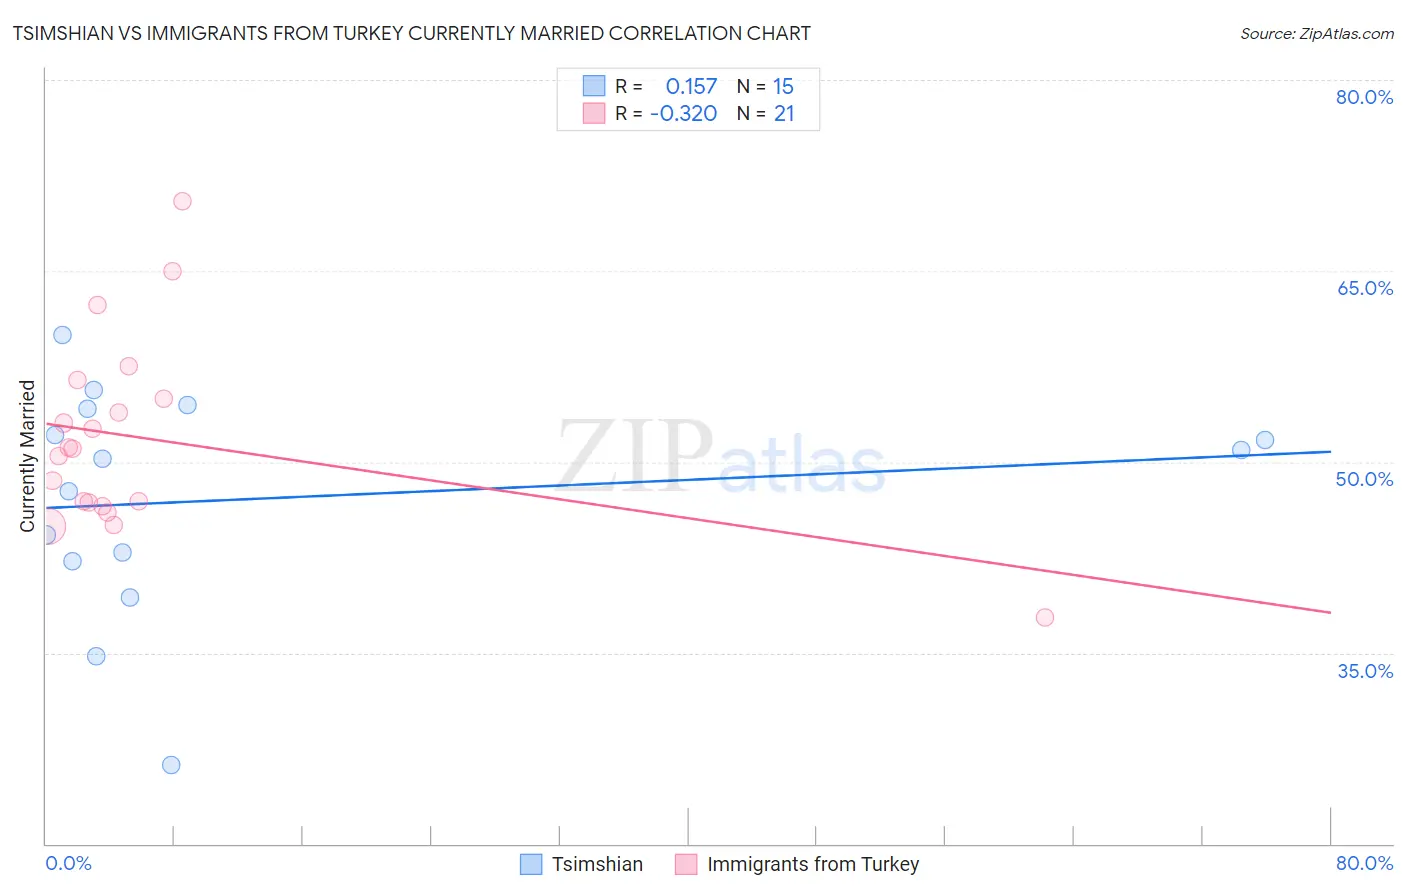
Tsimshian vs Immigrants from Turkey Currently Married Correlation Chart
The statistical analysis conducted on geographies consisting of 15,626,544 people shows a poor positive correlation between the proportion of Tsimshian and percentage of population currently married in the United States with a correlation coefficient (R) of 0.157 and weighted average of 47.7%. Similarly, the statistical analysis conducted on geographies consisting of 223,037,239 people shows a mild negative correlation between the proportion of Immigrants from Turkey and percentage of population currently married in the United States with a correlation coefficient (R) of -0.320 and weighted average of 47.0%, a difference of 1.5%.
Currently Married Correlation Summary
| Measurement | Tsimshian | Immigrants from Turkey |
| Minimum | 26.2% | 37.8% |
| Maximum | 60.0% | 70.5% |
| Range | 33.8% | 32.7% |
| Mean | 47.1% | 51.8% |
| Median | 50.2% | 51.0% |
| Interquartile 25% (IQ1) | 42.2% | 46.7% |
| Interquartile 75% (IQ3) | 54.2% | 55.7% |
| Interquartile Range (IQR) | 12.0% | 9.0% |
| Standard Deviation (Sample) | 8.9% | 7.6% |
| Standard Deviation (Population) | 8.6% | 7.4% |
Similar Demographics by Currently Married
Demographics Similar to Tsimshian by Currently Married
In terms of currently married, the demographic groups most similar to Tsimshian are Immigrants from Egypt (47.7%, a difference of 0.010%), Immigrants from Russia (47.7%, a difference of 0.050%), Immigrants from Italy (47.7%, a difference of 0.060%), Immigrants from Greece (47.7%, a difference of 0.090%), and Immigrants from Singapore (47.8%, a difference of 0.12%).
| Demographics | Rating | Rank | Currently Married |
| Immigrants | Germany | 94.1 /100 | #101 | Exceptional 47.8% |
| Turks | 93.9 /100 | #102 | Exceptional 47.8% |
| Cypriots | 93.7 /100 | #103 | Exceptional 47.8% |
| Serbians | 93.6 /100 | #104 | Exceptional 47.8% |
| Immigrants | Singapore | 93.3 /100 | #105 | Exceptional 47.8% |
| Immigrants | Greece | 93.1 /100 | #106 | Exceptional 47.7% |
| Immigrants | Italy | 92.9 /100 | #107 | Exceptional 47.7% |
| Tsimshian | 92.4 /100 | #108 | Exceptional 47.7% |
| Immigrants | Egypt | 92.3 /100 | #109 | Exceptional 47.7% |
| Immigrants | Russia | 92.0 /100 | #110 | Exceptional 47.7% |
| Immigrants | Hungary | 91.2 /100 | #111 | Exceptional 47.6% |
| Immigrants | Western Europe | 91.1 /100 | #112 | Exceptional 47.6% |
| Immigrants | Denmark | 90.9 /100 | #113 | Exceptional 47.6% |
| South Africans | 90.5 /100 | #114 | Exceptional 47.6% |
| Immigrants | Indonesia | 90.5 /100 | #115 | Exceptional 47.6% |
Demographics Similar to Immigrants from Turkey by Currently Married
In terms of currently married, the demographic groups most similar to Immigrants from Turkey are Zimbabwean (47.0%, a difference of 0.0%), Cambodian (47.0%, a difference of 0.010%), Chilean (47.0%, a difference of 0.010%), Immigrants from Serbia (47.0%, a difference of 0.050%), and Immigrants from Venezuela (47.0%, a difference of 0.060%).
| Demographics | Rating | Rank | Currently Married |
| Guamanians/Chamorros | 74.2 /100 | #143 | Good 47.1% |
| Hmong | 73.4 /100 | #144 | Good 47.1% |
| Immigrants | South Eastern Asia | 72.9 /100 | #145 | Good 47.1% |
| Carpatho Rusyns | 72.6 /100 | #146 | Good 47.0% |
| Immigrants | Argentina | 72.0 /100 | #147 | Good 47.0% |
| Cambodians | 70.4 /100 | #148 | Good 47.0% |
| Zimbabweans | 70.1 /100 | #149 | Good 47.0% |
| Immigrants | Turkey | 70.0 /100 | #150 | Good 47.0% |
| Chileans | 69.8 /100 | #151 | Good 47.0% |
| Immigrants | Serbia | 68.8 /100 | #152 | Good 47.0% |
| Immigrants | Venezuela | 68.6 /100 | #153 | Good 47.0% |
| Albanians | 68.6 /100 | #154 | Good 47.0% |
| Arabs | 68.6 /100 | #155 | Good 47.0% |
| Spanish | 68.1 /100 | #156 | Good 47.0% |
| Immigrants | Switzerland | 67.8 /100 | #157 | Good 46.9% |