Swedish vs Hungarian Currently Married
COMPARE
Swedish
Hungarian
Currently Married
Currently Married Comparison
Swedes
Hungarians
50.0%
CURRENTLY MARRIED
100.0/ 100
METRIC RATING
8th/ 347
METRIC RANK
48.8%
CURRENTLY MARRIED
99.4/ 100
METRIC RATING
37th/ 347
METRIC RANK
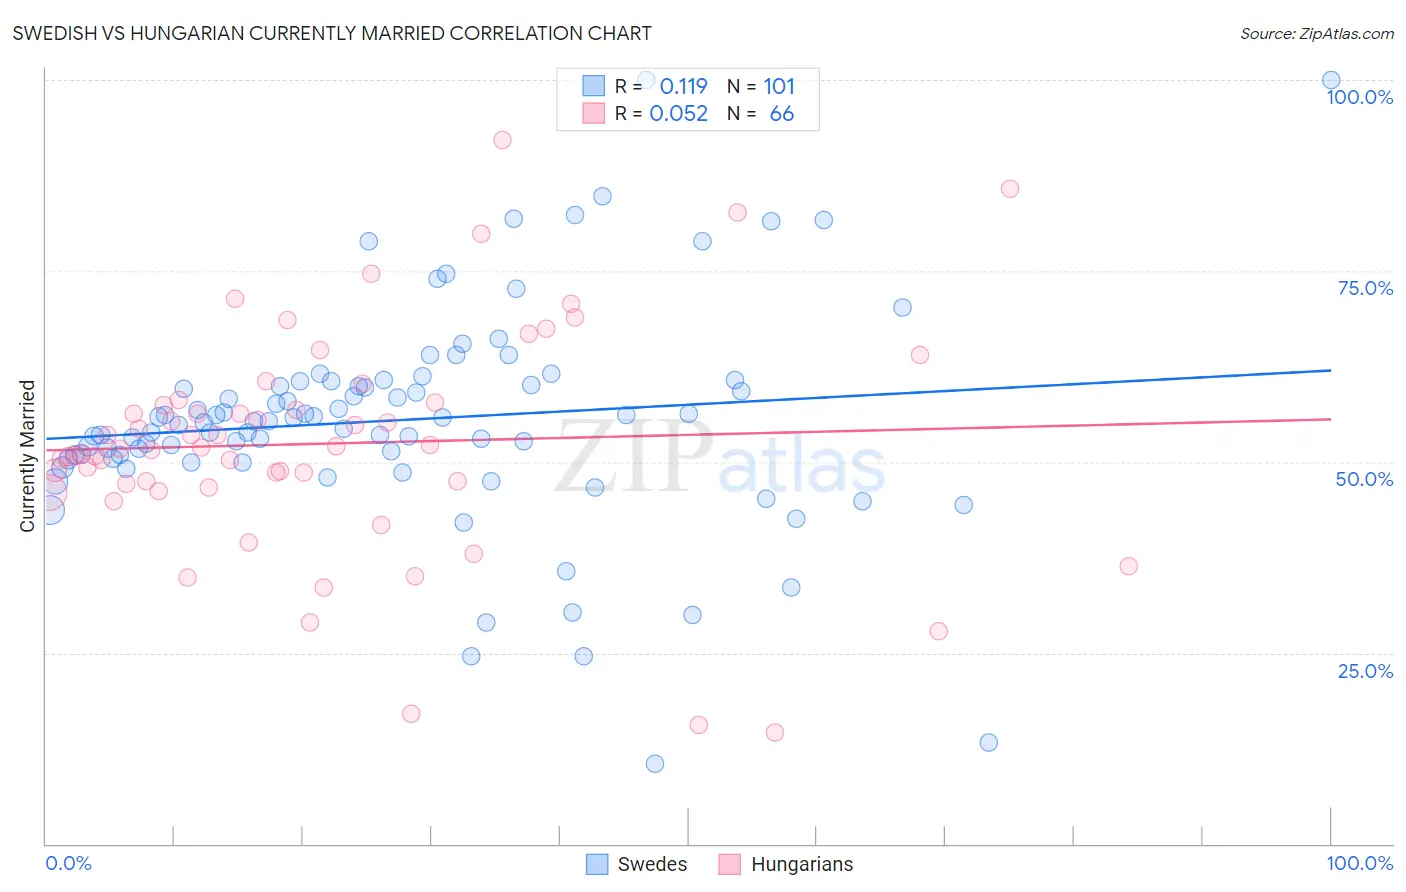
Swedish vs Hungarian Currently Married Correlation Chart
The statistical analysis conducted on geographies consisting of 539,138,052 people shows a poor positive correlation between the proportion of Swedes and percentage of population currently married in the United States with a correlation coefficient (R) of 0.119 and weighted average of 50.0%. Similarly, the statistical analysis conducted on geographies consisting of 486,182,197 people shows a slight positive correlation between the proportion of Hungarians and percentage of population currently married in the United States with a correlation coefficient (R) of 0.052 and weighted average of 48.8%, a difference of 2.3%.
Currently Married Correlation Summary
| Measurement | Swedish | Hungarian |
| Minimum | 10.5% | 14.5% |
| Maximum | 100.0% | 92.1% |
| Range | 89.5% | 77.6% |
| Mean | 55.5% | 52.4% |
| Median | 55.3% | 51.8% |
| Interquartile 25% (IQ1) | 50.4% | 47.1% |
| Interquartile 75% (IQ3) | 60.2% | 57.7% |
| Interquartile Range (IQR) | 9.9% | 10.6% |
| Standard Deviation (Sample) | 14.4% | 14.9% |
| Standard Deviation (Population) | 14.4% | 14.7% |
Similar Demographics by Currently Married
Demographics Similar to Swedes by Currently Married
In terms of currently married, the demographic groups most similar to Swedes are Immigrants from South Central Asia (50.0%, a difference of 0.13%), Czech (49.9%, a difference of 0.19%), Filipino (49.7%, a difference of 0.45%), English (49.7%, a difference of 0.46%), and Swiss (49.7%, a difference of 0.46%).
| Demographics | Rating | Rank | Currently Married |
| Immigrants | India | 100.0 /100 | #1 | Exceptional 51.8% |
| Thais | 100.0 /100 | #2 | Exceptional 50.9% |
| Assyrians/Chaldeans/Syriacs | 100.0 /100 | #3 | Exceptional 50.8% |
| Immigrants | Taiwan | 100.0 /100 | #4 | Exceptional 50.7% |
| Danes | 100.0 /100 | #5 | Exceptional 50.5% |
| Norwegians | 100.0 /100 | #6 | Exceptional 50.2% |
| Immigrants | South Central Asia | 100.0 /100 | #7 | Exceptional 50.0% |
| Swedes | 100.0 /100 | #8 | Exceptional 50.0% |
| Czechs | 99.9 /100 | #9 | Exceptional 49.9% |
| Filipinos | 99.9 /100 | #10 | Exceptional 49.7% |
| English | 99.9 /100 | #11 | Exceptional 49.7% |
| Swiss | 99.9 /100 | #12 | Exceptional 49.7% |
| Dutch | 99.9 /100 | #13 | Exceptional 49.6% |
| Germans | 99.9 /100 | #14 | Exceptional 49.6% |
| Pennsylvania Germans | 99.9 /100 | #15 | Exceptional 49.6% |
Demographics Similar to Hungarians by Currently Married
In terms of currently married, the demographic groups most similar to Hungarians are Italian (48.8%, a difference of 0.0%), Immigrants from Northern Europe (48.8%, a difference of 0.010%), Immigrants from Lithuania (48.8%, a difference of 0.030%), Czechoslovakian (48.8%, a difference of 0.040%), and British (48.8%, a difference of 0.070%).
| Demographics | Rating | Rank | Currently Married |
| Eastern Europeans | 99.5 /100 | #30 | Exceptional 48.9% |
| Poles | 99.5 /100 | #31 | Exceptional 48.9% |
| Immigrants | Hong Kong | 99.5 /100 | #32 | Exceptional 48.9% |
| Irish | 99.5 /100 | #33 | Exceptional 48.9% |
| Immigrants | Lithuania | 99.4 /100 | #34 | Exceptional 48.8% |
| Immigrants | Northern Europe | 99.4 /100 | #35 | Exceptional 48.8% |
| Italians | 99.4 /100 | #36 | Exceptional 48.8% |
| Hungarians | 99.4 /100 | #37 | Exceptional 48.8% |
| Czechoslovakians | 99.4 /100 | #38 | Exceptional 48.8% |
| British | 99.4 /100 | #39 | Exceptional 48.8% |
| Immigrants | Canada | 99.4 /100 | #40 | Exceptional 48.8% |
| Greeks | 99.3 /100 | #41 | Exceptional 48.8% |
| Finns | 99.3 /100 | #42 | Exceptional 48.8% |
| Scotch-Irish | 99.3 /100 | #43 | Exceptional 48.7% |
| Immigrants | North America | 99.3 /100 | #44 | Exceptional 48.7% |