Tsimshian vs Hungarian Child Poverty Under the Age of 5
COMPARE
Tsimshian
Hungarian
Child Poverty Under the Age of 5
Child Poverty Under the Age of 5 Comparison
Tsimshian
Hungarians
14.7%
CHILD POVERTY UNDER THE AGE OF 5
99.6/ 100
METRIC RATING
46th/ 347
METRIC RANK
17.9%
CHILD POVERTY UNDER THE AGE OF 5
18.3/ 100
METRIC RATING
199th/ 347
METRIC RANK
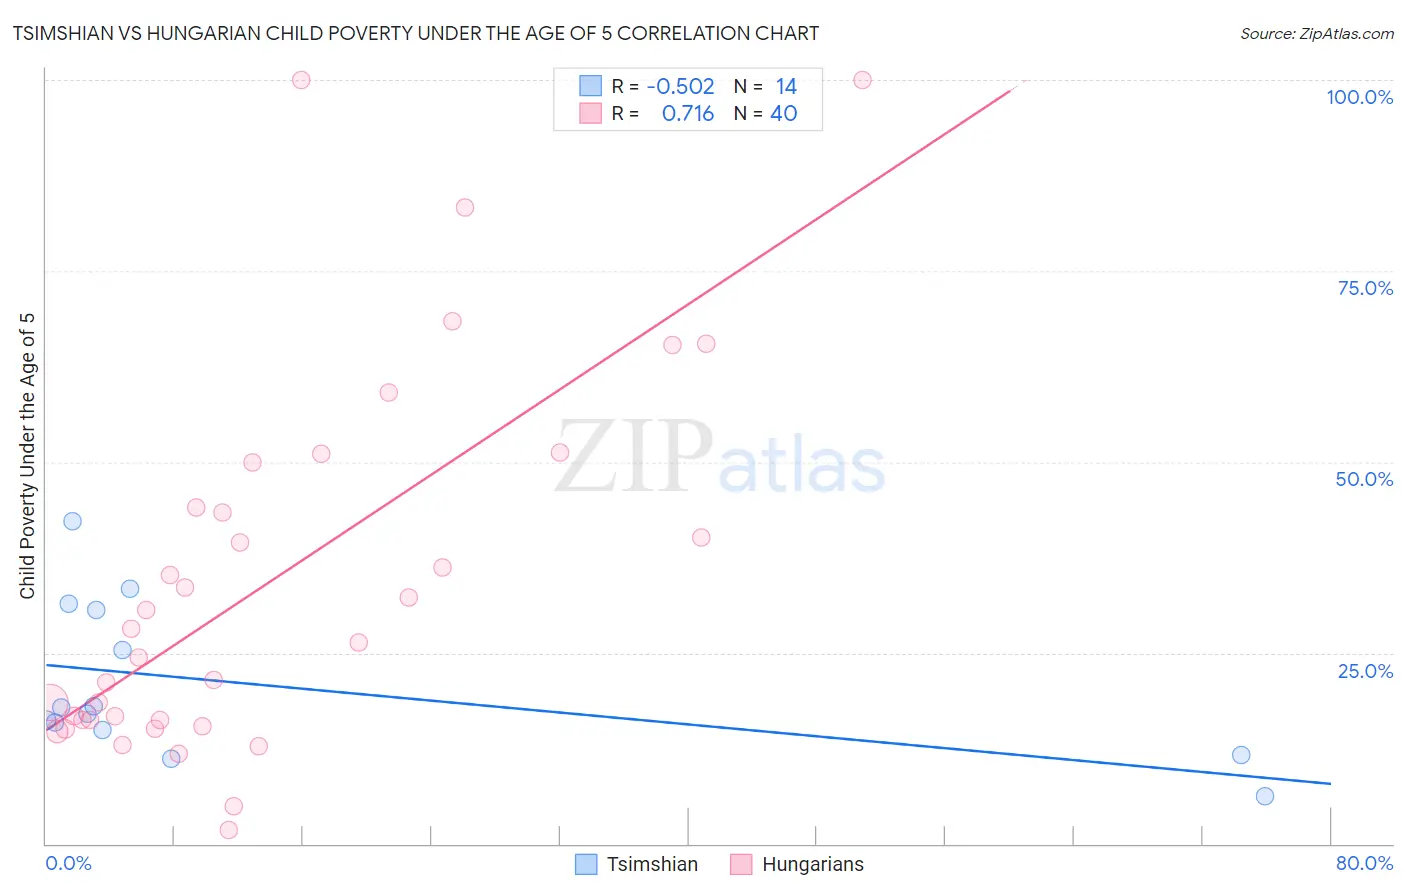
Tsimshian vs Hungarian Child Poverty Under the Age of 5 Correlation Chart
The statistical analysis conducted on geographies consisting of 15,568,381 people shows a substantial negative correlation between the proportion of Tsimshian and poverty level among children under the age of 5 in the United States with a correlation coefficient (R) of -0.502 and weighted average of 14.7%. Similarly, the statistical analysis conducted on geographies consisting of 457,399,489 people shows a strong positive correlation between the proportion of Hungarians and poverty level among children under the age of 5 in the United States with a correlation coefficient (R) of 0.716 and weighted average of 17.9%, a difference of 21.5%.
Child Poverty Under the Age of 5 Correlation Summary
| Measurement | Tsimshian | Hungarian |
| Minimum | 6.2% | 1.7% |
| Maximum | 42.3% | 100.0% |
| Range | 36.2% | 98.3% |
| Mean | 20.8% | 34.3% |
| Median | 17.4% | 27.2% |
| Interquartile 25% (IQ1) | 14.9% | 16.2% |
| Interquartile 75% (IQ3) | 30.6% | 47.0% |
| Interquartile Range (IQR) | 15.6% | 30.9% |
| Standard Deviation (Sample) | 10.2% | 24.4% |
| Standard Deviation (Population) | 9.8% | 24.1% |
Similar Demographics by Child Poverty Under the Age of 5
Demographics Similar to Tsimshian by Child Poverty Under the Age of 5
In terms of child poverty under the age of 5, the demographic groups most similar to Tsimshian are Laotian (14.7%, a difference of 0.080%), Russian (14.8%, a difference of 0.14%), Immigrants from Philippines (14.7%, a difference of 0.20%), Immigrants from Czechoslovakia (14.8%, a difference of 0.24%), and Soviet Union (14.7%, a difference of 0.34%).
| Demographics | Rating | Rank | Child Poverty Under the Age of 5 |
| Norwegians | 99.7 /100 | #39 | Exceptional 14.6% |
| Immigrants | Australia | 99.7 /100 | #40 | Exceptional 14.6% |
| Immigrants | Belarus | 99.7 /100 | #41 | Exceptional 14.7% |
| Soviet Union | 99.7 /100 | #42 | Exceptional 14.7% |
| Immigrants | Greece | 99.7 /100 | #43 | Exceptional 14.7% |
| Immigrants | Philippines | 99.7 /100 | #44 | Exceptional 14.7% |
| Laotians | 99.6 /100 | #45 | Exceptional 14.7% |
| Tsimshian | 99.6 /100 | #46 | Exceptional 14.7% |
| Russians | 99.6 /100 | #47 | Exceptional 14.8% |
| Immigrants | Czechoslovakia | 99.6 /100 | #48 | Exceptional 14.8% |
| Immigrants | Bulgaria | 99.6 /100 | #49 | Exceptional 14.8% |
| Immigrants | Northern Europe | 99.6 /100 | #50 | Exceptional 14.8% |
| Estonians | 99.6 /100 | #51 | Exceptional 14.8% |
| Immigrants | Serbia | 99.5 /100 | #52 | Exceptional 14.9% |
| Luxembourgers | 99.4 /100 | #53 | Exceptional 14.9% |
Demographics Similar to Hungarians by Child Poverty Under the Age of 5
In terms of child poverty under the age of 5, the demographic groups most similar to Hungarians are Celtic (17.9%, a difference of 0.010%), Immigrants from Kenya (17.9%, a difference of 0.28%), Immigrants from Portugal (17.8%, a difference of 0.61%), Iraqi (18.0%, a difference of 0.80%), and Ugandan (18.0%, a difference of 0.81%).
| Demographics | Rating | Rank | Child Poverty Under the Age of 5 |
| Immigrants | Uruguay | 27.8 /100 | #192 | Fair 17.7% |
| Immigrants | Uganda | 25.0 /100 | #193 | Fair 17.7% |
| French Canadians | 24.6 /100 | #194 | Fair 17.7% |
| Sierra Leoneans | 24.1 /100 | #195 | Fair 17.7% |
| Immigrants | Portugal | 22.2 /100 | #196 | Fair 17.8% |
| Immigrants | Kenya | 20.0 /100 | #197 | Fair 17.9% |
| Celtics | 18.3 /100 | #198 | Poor 17.9% |
| Hungarians | 18.3 /100 | #199 | Poor 17.9% |
| Iraqis | 14.0 /100 | #200 | Poor 18.0% |
| Ugandans | 13.9 /100 | #201 | Poor 18.0% |
| Japanese | 13.8 /100 | #202 | Poor 18.1% |
| Immigrants | Cambodia | 13.7 /100 | #203 | Poor 18.1% |
| Immigrants | Eastern Africa | 13.4 /100 | #204 | Poor 18.1% |
| Spaniards | 12.8 /100 | #205 | Poor 18.1% |
| Whites/Caucasians | 12.6 /100 | #206 | Poor 18.1% |