Bulgarian vs Hungarian Currently Married
COMPARE
Bulgarian
Hungarian
Currently Married
Currently Married Comparison
Bulgarians
Hungarians
49.1%
CURRENTLY MARRIED
99.7/ 100
METRIC RATING
22nd/ 347
METRIC RANK
48.8%
CURRENTLY MARRIED
99.4/ 100
METRIC RATING
37th/ 347
METRIC RANK
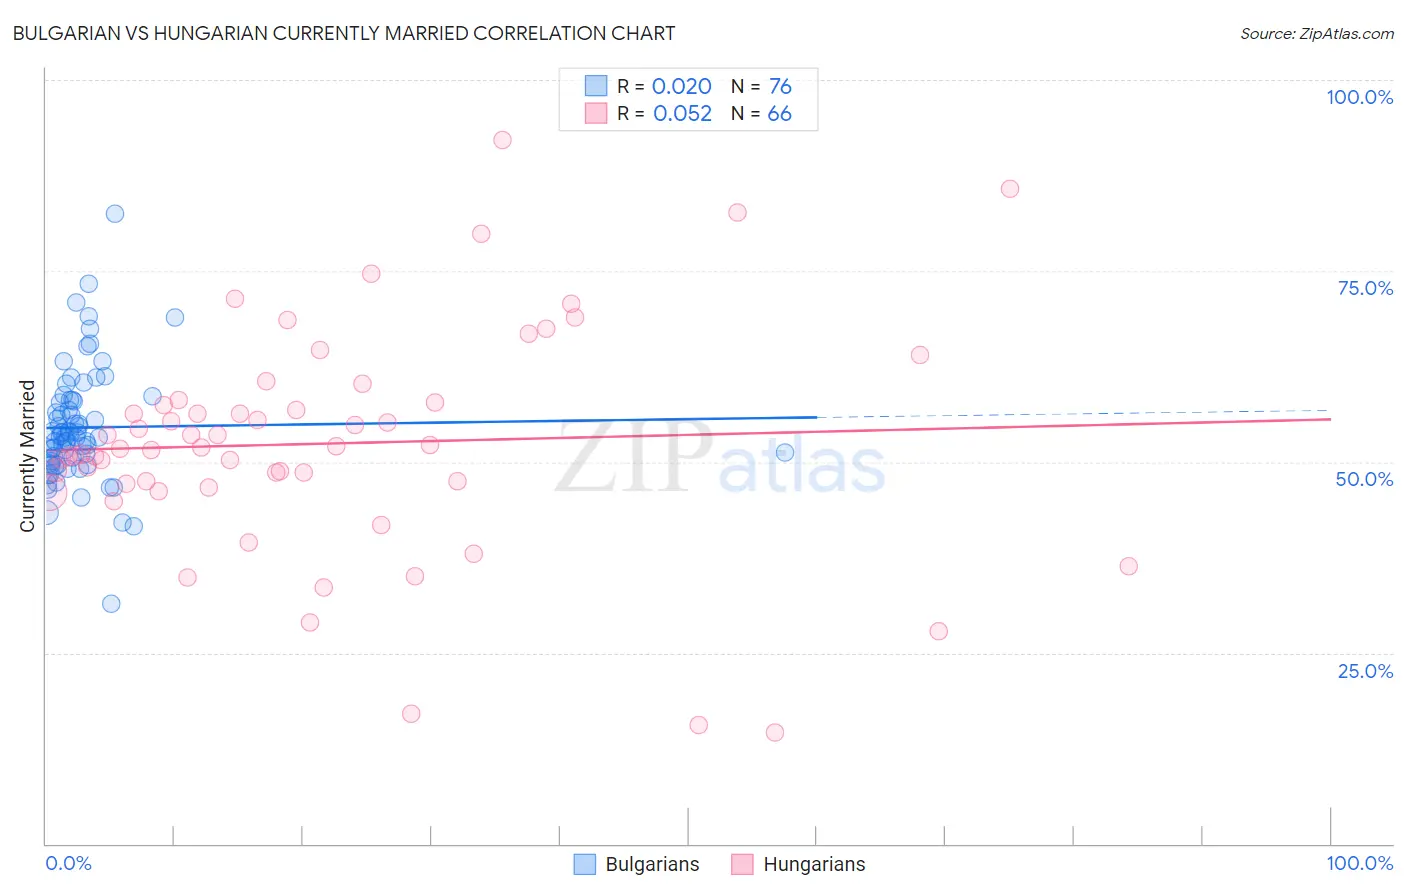
Bulgarian vs Hungarian Currently Married Correlation Chart
The statistical analysis conducted on geographies consisting of 205,615,003 people shows no correlation between the proportion of Bulgarians and percentage of population currently married in the United States with a correlation coefficient (R) of 0.020 and weighted average of 49.1%. Similarly, the statistical analysis conducted on geographies consisting of 486,182,197 people shows a slight positive correlation between the proportion of Hungarians and percentage of population currently married in the United States with a correlation coefficient (R) of 0.052 and weighted average of 48.8%, a difference of 0.59%.
Currently Married Correlation Summary
| Measurement | Bulgarian | Hungarian |
| Minimum | 31.5% | 14.5% |
| Maximum | 82.5% | 92.1% |
| Range | 51.0% | 77.6% |
| Mean | 54.5% | 52.4% |
| Median | 53.3% | 51.8% |
| Interquartile 25% (IQ1) | 49.9% | 47.1% |
| Interquartile 75% (IQ3) | 58.0% | 57.7% |
| Interquartile Range (IQR) | 8.1% | 10.6% |
| Standard Deviation (Sample) | 7.7% | 14.9% |
| Standard Deviation (Population) | 7.6% | 14.7% |
Demographics Similar to Bulgarians and Hungarians by Currently Married
In terms of currently married, the demographic groups most similar to Bulgarians are Immigrants from Pakistan (49.1%, a difference of 0.11%), Scottish (49.2%, a difference of 0.22%), Lithuanian (49.0%, a difference of 0.22%), Maltese (49.0%, a difference of 0.23%), and Immigrants from Korea (49.0%, a difference of 0.28%). Similarly, the demographic groups most similar to Hungarians are Italian (48.8%, a difference of 0.0%), Immigrants from Northern Europe (48.8%, a difference of 0.010%), Immigrants from Lithuania (48.8%, a difference of 0.030%), Czechoslovakian (48.8%, a difference of 0.040%), and British (48.8%, a difference of 0.070%).
| Demographics | Rating | Rank | Currently Married |
| Europeans | 99.8 /100 | #19 | Exceptional 49.3% |
| Luxembourgers | 99.8 /100 | #20 | Exceptional 49.3% |
| Scottish | 99.8 /100 | #21 | Exceptional 49.2% |
| Bulgarians | 99.7 /100 | #22 | Exceptional 49.1% |
| Immigrants | Pakistan | 99.7 /100 | #23 | Exceptional 49.1% |
| Lithuanians | 99.6 /100 | #24 | Exceptional 49.0% |
| Maltese | 99.6 /100 | #25 | Exceptional 49.0% |
| Immigrants | Korea | 99.6 /100 | #26 | Exceptional 49.0% |
| Burmese | 99.6 /100 | #27 | Exceptional 48.9% |
| Welsh | 99.5 /100 | #28 | Exceptional 48.9% |
| Croatians | 99.5 /100 | #29 | Exceptional 48.9% |
| Eastern Europeans | 99.5 /100 | #30 | Exceptional 48.9% |
| Poles | 99.5 /100 | #31 | Exceptional 48.9% |
| Immigrants | Hong Kong | 99.5 /100 | #32 | Exceptional 48.9% |
| Irish | 99.5 /100 | #33 | Exceptional 48.9% |
| Immigrants | Lithuania | 99.4 /100 | #34 | Exceptional 48.8% |
| Immigrants | Northern Europe | 99.4 /100 | #35 | Exceptional 48.8% |
| Italians | 99.4 /100 | #36 | Exceptional 48.8% |
| Hungarians | 99.4 /100 | #37 | Exceptional 48.8% |
| Czechoslovakians | 99.4 /100 | #38 | Exceptional 48.8% |
| British | 99.4 /100 | #39 | Exceptional 48.8% |