Tsimshian vs U.S. Virgin Islander Currently Married
COMPARE
Tsimshian
U.S. Virgin Islander
Currently Married
Currently Married Comparison
Tsimshian
U.S. Virgin Islanders
47.7%
CURRENTLY MARRIED
92.4/ 100
METRIC RATING
108th/ 347
METRIC RANK
40.7%
CURRENTLY MARRIED
0.0/ 100
METRIC RATING
325th/ 347
METRIC RANK
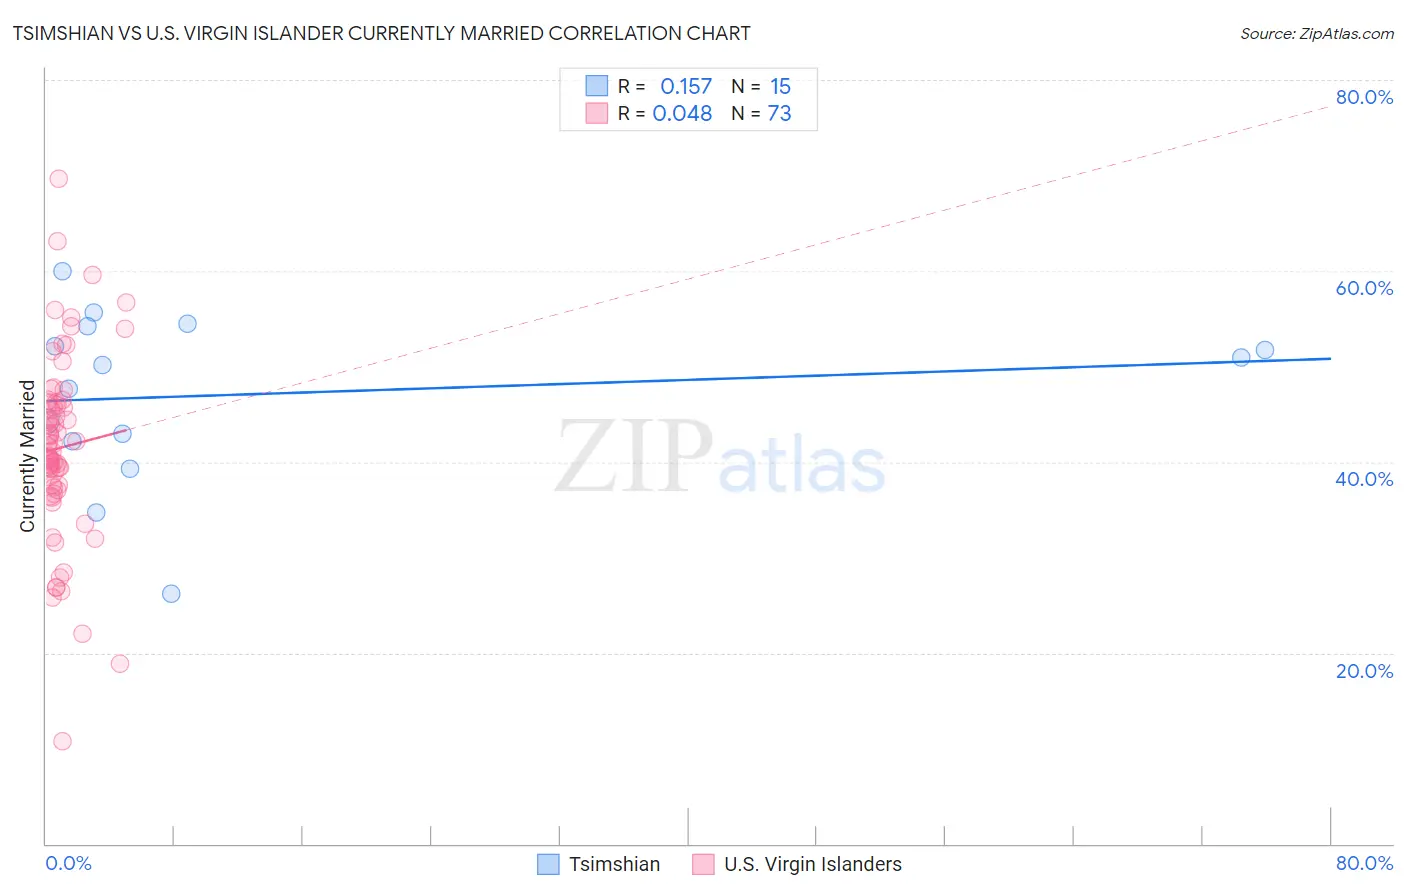
Tsimshian vs U.S. Virgin Islander Currently Married Correlation Chart
The statistical analysis conducted on geographies consisting of 15,626,544 people shows a poor positive correlation between the proportion of Tsimshian and percentage of population currently married in the United States with a correlation coefficient (R) of 0.157 and weighted average of 47.7%. Similarly, the statistical analysis conducted on geographies consisting of 87,525,763 people shows no correlation between the proportion of U.S. Virgin Islanders and percentage of population currently married in the United States with a correlation coefficient (R) of 0.048 and weighted average of 40.7%, a difference of 17.2%.
Currently Married Correlation Summary
| Measurement | Tsimshian | U.S. Virgin Islander |
| Minimum | 26.2% | 10.7% |
| Maximum | 60.0% | 69.6% |
| Range | 33.8% | 58.9% |
| Mean | 47.1% | 41.5% |
| Median | 50.2% | 41.7% |
| Interquartile 25% (IQ1) | 42.2% | 37.2% |
| Interquartile 75% (IQ3) | 54.2% | 46.2% |
| Interquartile Range (IQR) | 12.0% | 9.0% |
| Standard Deviation (Sample) | 8.9% | 9.8% |
| Standard Deviation (Population) | 8.6% | 9.7% |
Similar Demographics by Currently Married
Demographics Similar to Tsimshian by Currently Married
In terms of currently married, the demographic groups most similar to Tsimshian are Immigrants from Egypt (47.7%, a difference of 0.010%), Immigrants from Russia (47.7%, a difference of 0.050%), Immigrants from Italy (47.7%, a difference of 0.060%), Immigrants from Greece (47.7%, a difference of 0.090%), and Immigrants from Singapore (47.8%, a difference of 0.12%).
| Demographics | Rating | Rank | Currently Married |
| Immigrants | Germany | 94.1 /100 | #101 | Exceptional 47.8% |
| Turks | 93.9 /100 | #102 | Exceptional 47.8% |
| Cypriots | 93.7 /100 | #103 | Exceptional 47.8% |
| Serbians | 93.6 /100 | #104 | Exceptional 47.8% |
| Immigrants | Singapore | 93.3 /100 | #105 | Exceptional 47.8% |
| Immigrants | Greece | 93.1 /100 | #106 | Exceptional 47.7% |
| Immigrants | Italy | 92.9 /100 | #107 | Exceptional 47.7% |
| Tsimshian | 92.4 /100 | #108 | Exceptional 47.7% |
| Immigrants | Egypt | 92.3 /100 | #109 | Exceptional 47.7% |
| Immigrants | Russia | 92.0 /100 | #110 | Exceptional 47.7% |
| Immigrants | Hungary | 91.2 /100 | #111 | Exceptional 47.6% |
| Immigrants | Western Europe | 91.1 /100 | #112 | Exceptional 47.6% |
| Immigrants | Denmark | 90.9 /100 | #113 | Exceptional 47.6% |
| South Africans | 90.5 /100 | #114 | Exceptional 47.6% |
| Immigrants | Indonesia | 90.5 /100 | #115 | Exceptional 47.6% |
Demographics Similar to U.S. Virgin Islanders by Currently Married
In terms of currently married, the demographic groups most similar to U.S. Virgin Islanders are Immigrants from Senegal (40.7%, a difference of 0.050%), Immigrants from West Indies (40.7%, a difference of 0.060%), Barbadian (40.6%, a difference of 0.14%), Senegalese (40.6%, a difference of 0.31%), and Arapaho (40.5%, a difference of 0.35%).
| Demographics | Rating | Rank | Currently Married |
| Bahamians | 0.0 /100 | #318 | Tragic 41.2% |
| Immigrants | Somalia | 0.0 /100 | #319 | Tragic 41.2% |
| Immigrants | Jamaica | 0.0 /100 | #320 | Tragic 41.1% |
| Immigrants | Congo | 0.0 /100 | #321 | Tragic 41.1% |
| Immigrants | Haiti | 0.0 /100 | #322 | Tragic 41.0% |
| Immigrants | West Indies | 0.0 /100 | #323 | Tragic 40.7% |
| Immigrants | Senegal | 0.0 /100 | #324 | Tragic 40.7% |
| U.S. Virgin Islanders | 0.0 /100 | #325 | Tragic 40.7% |
| Barbadians | 0.0 /100 | #326 | Tragic 40.6% |
| Senegalese | 0.0 /100 | #327 | Tragic 40.6% |
| Arapaho | 0.0 /100 | #328 | Tragic 40.5% |
| Crow | 0.0 /100 | #329 | Tragic 40.4% |
| Immigrants | Dominica | 0.0 /100 | #330 | Tragic 40.3% |
| Immigrants | Barbados | 0.0 /100 | #331 | Tragic 40.3% |
| Immigrants | St. Vincent and the Grenadines | 0.0 /100 | #332 | Tragic 40.1% |