Trinidadian and Tobagonian vs Immigrants from St. Vincent and the Grenadines Births to Unmarried Women
COMPARE
Trinidadian and Tobagonian
Immigrants from St. Vincent and the Grenadines
Births to Unmarried Women
Births to Unmarried Women Comparison
Trinidadians and Tobagonians
Immigrants from St. Vincent and the Grenadines
36.5%
BIRTHS TO UNMARRIED WOMEN
0.2/ 100
METRIC RATING
261st/ 347
METRIC RANK
37.3%
BIRTHS TO UNMARRIED WOMEN
0.1/ 100
METRIC RATING
280th/ 347
METRIC RANK
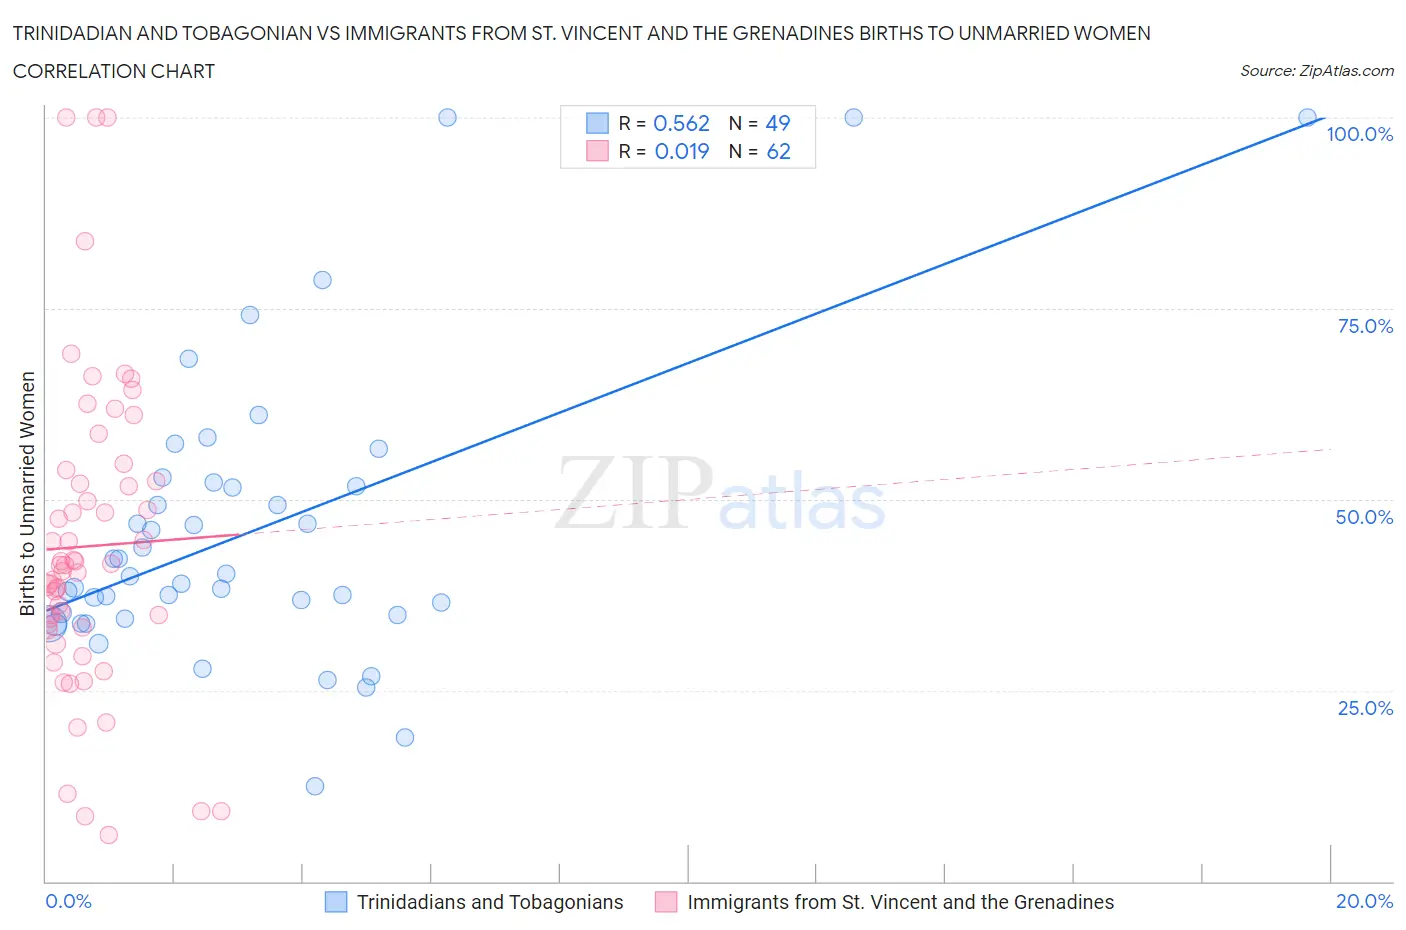
Trinidadian and Tobagonian vs Immigrants from St. Vincent and the Grenadines Births to Unmarried Women Correlation Chart
The statistical analysis conducted on geographies consisting of 212,407,546 people shows a substantial positive correlation between the proportion of Trinidadians and Tobagonians and percentage of births to unmarried women in the United States with a correlation coefficient (R) of 0.562 and weighted average of 36.5%. Similarly, the statistical analysis conducted on geographies consisting of 55,457,752 people shows no correlation between the proportion of Immigrants from St. Vincent and the Grenadines and percentage of births to unmarried women in the United States with a correlation coefficient (R) of 0.019 and weighted average of 37.3%, a difference of 2.3%.
Births to Unmarried Women Correlation Summary
| Measurement | Trinidadian and Tobagonian | Immigrants from St. Vincent and the Grenadines |
| Minimum | 12.5% | 6.0% |
| Maximum | 100.0% | 100.0% |
| Range | 87.5% | 94.0% |
| Mean | 45.7% | 43.9% |
| Median | 39.9% | 41.5% |
| Interquartile 25% (IQ1) | 34.6% | 33.3% |
| Interquartile 75% (IQ3) | 52.0% | 52.4% |
| Interquartile Range (IQR) | 17.4% | 19.1% |
| Standard Deviation (Sample) | 19.0% | 20.4% |
| Standard Deviation (Population) | 18.8% | 20.2% |
Demographics Similar to Trinidadians and Tobagonians and Immigrants from St. Vincent and the Grenadines by Births to Unmarried Women
In terms of births to unmarried women, the demographic groups most similar to Trinidadians and Tobagonians are Ottawa (36.5%, a difference of 0.0%), French American Indian (36.6%, a difference of 0.37%), Nicaraguan (36.6%, a difference of 0.38%), Subsaharan African (36.7%, a difference of 0.51%), and Cherokee (36.7%, a difference of 0.56%). Similarly, the demographic groups most similar to Immigrants from St. Vincent and the Grenadines are West Indian (37.3%, a difference of 0.12%), Immigrants from Latin America (37.1%, a difference of 0.45%), Guatemalan (37.1%, a difference of 0.54%), Belizean (37.0%, a difference of 0.75%), and Barbadian (37.0%, a difference of 0.95%).
| Demographics | Rating | Rank | Births to Unmarried Women |
| Ottawa | 0.2 /100 | #260 | Tragic 36.5% |
| Trinidadians and Tobagonians | 0.2 /100 | #261 | Tragic 36.5% |
| French American Indians | 0.1 /100 | #262 | Tragic 36.6% |
| Nicaraguans | 0.1 /100 | #263 | Tragic 36.6% |
| Sub-Saharan Africans | 0.1 /100 | #264 | Tragic 36.7% |
| Cherokee | 0.1 /100 | #265 | Tragic 36.7% |
| Immigrants | Senegal | 0.1 /100 | #266 | Tragic 36.7% |
| Central Americans | 0.1 /100 | #267 | Tragic 36.7% |
| Comanche | 0.1 /100 | #268 | Tragic 36.7% |
| Senegalese | 0.1 /100 | #269 | Tragic 36.8% |
| Immigrants | Congo | 0.1 /100 | #270 | Tragic 36.8% |
| Immigrants | Barbados | 0.1 /100 | #271 | Tragic 36.8% |
| Choctaw | 0.1 /100 | #272 | Tragic 36.9% |
| Mexicans | 0.1 /100 | #273 | Tragic 36.9% |
| Cree | 0.1 /100 | #274 | Tragic 37.0% |
| Barbadians | 0.1 /100 | #275 | Tragic 37.0% |
| Belizeans | 0.1 /100 | #276 | Tragic 37.0% |
| Guatemalans | 0.1 /100 | #277 | Tragic 37.1% |
| Immigrants | Latin America | 0.1 /100 | #278 | Tragic 37.1% |
| West Indians | 0.1 /100 | #279 | Tragic 37.3% |
| Immigrants | St. Vincent and the Grenadines | 0.1 /100 | #280 | Tragic 37.3% |