Trinidadian and Tobagonian vs Immigrants from Middle Africa Births to Unmarried Women
COMPARE
Trinidadian and Tobagonian
Immigrants from Middle Africa
Births to Unmarried Women
Births to Unmarried Women Comparison
Trinidadians and Tobagonians
Immigrants from Middle Africa
36.5%
BIRTHS TO UNMARRIED WOMEN
0.2/ 100
METRIC RATING
261st/ 347
METRIC RANK
34.9%
BIRTHS TO UNMARRIED WOMEN
1.2/ 100
METRIC RATING
240th/ 347
METRIC RANK
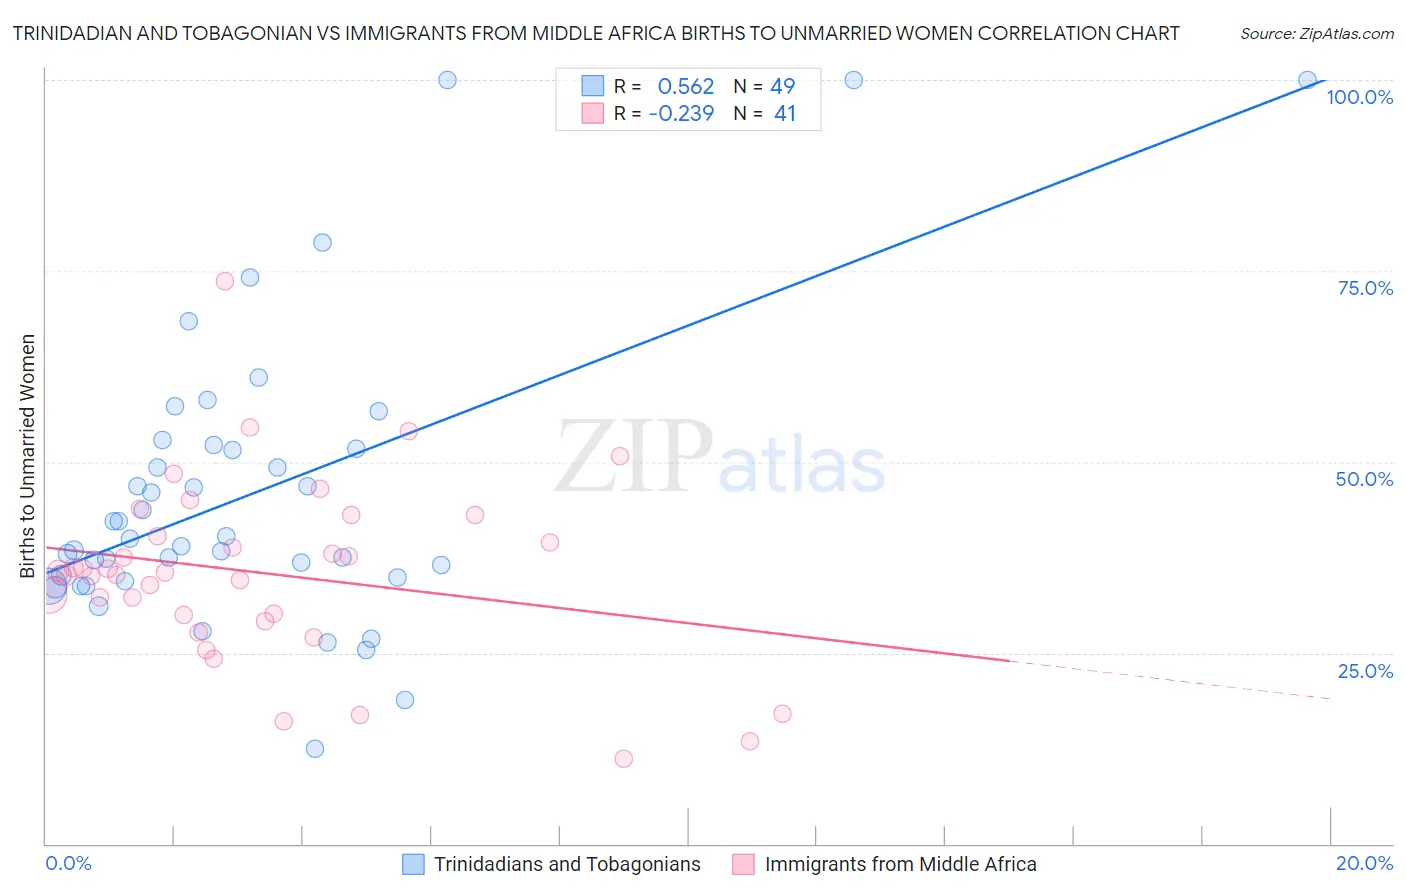
Trinidadian and Tobagonian vs Immigrants from Middle Africa Births to Unmarried Women Correlation Chart
The statistical analysis conducted on geographies consisting of 212,407,546 people shows a substantial positive correlation between the proportion of Trinidadians and Tobagonians and percentage of births to unmarried women in the United States with a correlation coefficient (R) of 0.562 and weighted average of 36.5%. Similarly, the statistical analysis conducted on geographies consisting of 197,160,822 people shows a weak negative correlation between the proportion of Immigrants from Middle Africa and percentage of births to unmarried women in the United States with a correlation coefficient (R) of -0.239 and weighted average of 34.9%, a difference of 4.4%.
Births to Unmarried Women Correlation Summary
| Measurement | Trinidadian and Tobagonian | Immigrants from Middle Africa |
| Minimum | 12.5% | 11.1% |
| Maximum | 100.0% | 73.7% |
| Range | 87.5% | 62.6% |
| Mean | 45.7% | 35.4% |
| Median | 39.9% | 35.4% |
| Interquartile 25% (IQ1) | 34.6% | 29.5% |
| Interquartile 75% (IQ3) | 52.0% | 41.6% |
| Interquartile Range (IQR) | 17.4% | 12.1% |
| Standard Deviation (Sample) | 19.0% | 11.9% |
| Standard Deviation (Population) | 18.8% | 11.8% |
Similar Demographics by Births to Unmarried Women
Demographics Similar to Trinidadians and Tobagonians by Births to Unmarried Women
In terms of births to unmarried women, the demographic groups most similar to Trinidadians and Tobagonians are Ottawa (36.5%, a difference of 0.0%), Immigrants from El Salvador (36.4%, a difference of 0.12%), American (36.4%, a difference of 0.17%), French American Indian (36.6%, a difference of 0.37%), and Nicaraguan (36.6%, a difference of 0.38%).
| Demographics | Rating | Rank | Births to Unmarried Women |
| Potawatomi | 0.2 /100 | #254 | Tragic 36.2% |
| Chickasaw | 0.2 /100 | #255 | Tragic 36.3% |
| Immigrants | Trinidad and Tobago | 0.2 /100 | #256 | Tragic 36.3% |
| Immigrants | Grenada | 0.2 /100 | #257 | Tragic 36.3% |
| Americans | 0.2 /100 | #258 | Tragic 36.4% |
| Immigrants | El Salvador | 0.2 /100 | #259 | Tragic 36.4% |
| Ottawa | 0.2 /100 | #260 | Tragic 36.5% |
| Trinidadians and Tobagonians | 0.2 /100 | #261 | Tragic 36.5% |
| French American Indians | 0.1 /100 | #262 | Tragic 36.6% |
| Nicaraguans | 0.1 /100 | #263 | Tragic 36.6% |
| Sub-Saharan Africans | 0.1 /100 | #264 | Tragic 36.7% |
| Cherokee | 0.1 /100 | #265 | Tragic 36.7% |
| Immigrants | Senegal | 0.1 /100 | #266 | Tragic 36.7% |
| Central Americans | 0.1 /100 | #267 | Tragic 36.7% |
| Comanche | 0.1 /100 | #268 | Tragic 36.7% |
Demographics Similar to Immigrants from Middle Africa by Births to Unmarried Women
In terms of births to unmarried women, the demographic groups most similar to Immigrants from Middle Africa are Immigrants from Guyana (35.0%, a difference of 0.030%), Indonesian (35.0%, a difference of 0.13%), Sierra Leonean (34.9%, a difference of 0.25%), Immigrants from Cambodia (34.8%, a difference of 0.47%), and Marshallese (34.8%, a difference of 0.53%).
| Demographics | Rating | Rank | Births to Unmarried Women |
| Bangladeshis | 2.5 /100 | #233 | Tragic 34.4% |
| Immigrants | Zaire | 2.3 /100 | #234 | Tragic 34.5% |
| Immigrants | Ghana | 2.2 /100 | #235 | Tragic 34.5% |
| Immigrants | Cameroon | 1.6 /100 | #236 | Tragic 34.7% |
| Marshallese | 1.6 /100 | #237 | Tragic 34.8% |
| Immigrants | Cambodia | 1.6 /100 | #238 | Tragic 34.8% |
| Sierra Leoneans | 1.4 /100 | #239 | Tragic 34.9% |
| Immigrants | Middle Africa | 1.2 /100 | #240 | Tragic 34.9% |
| Immigrants | Guyana | 1.2 /100 | #241 | Tragic 35.0% |
| Indonesians | 1.2 /100 | #242 | Tragic 35.0% |
| Japanese | 0.9 /100 | #243 | Tragic 35.2% |
| Guyanese | 0.9 /100 | #244 | Tragic 35.2% |
| Shoshone | 0.8 /100 | #245 | Tragic 35.3% |
| Nigerians | 0.7 /100 | #246 | Tragic 35.3% |
| Immigrants | Nigeria | 0.7 /100 | #247 | Tragic 35.4% |