Trinidadian and Tobagonian vs U.S. Virgin Islander Births to Unmarried Women
COMPARE
Trinidadian and Tobagonian
U.S. Virgin Islander
Births to Unmarried Women
Births to Unmarried Women Comparison
Trinidadians and Tobagonians
U.S. Virgin Islanders
36.5%
BIRTHS TO UNMARRIED WOMEN
0.2/ 100
METRIC RATING
261st/ 347
METRIC RANK
39.6%
BIRTHS TO UNMARRIED WOMEN
0.0/ 100
METRIC RATING
312th/ 347
METRIC RANK
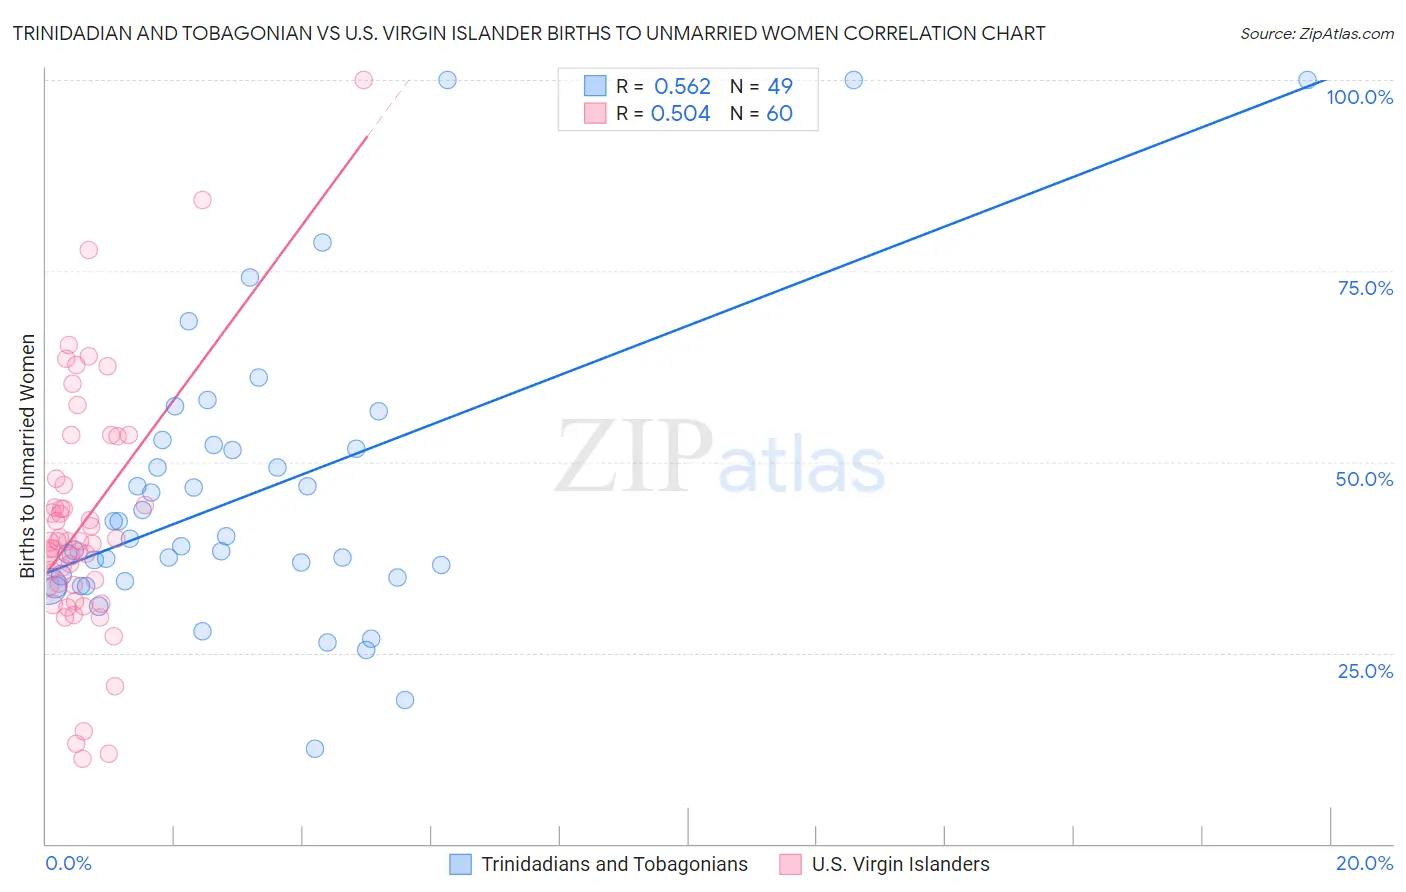
Trinidadian and Tobagonian vs U.S. Virgin Islander Births to Unmarried Women Correlation Chart
The statistical analysis conducted on geographies consisting of 212,407,546 people shows a substantial positive correlation between the proportion of Trinidadians and Tobagonians and percentage of births to unmarried women in the United States with a correlation coefficient (R) of 0.562 and weighted average of 36.5%. Similarly, the statistical analysis conducted on geographies consisting of 86,503,849 people shows a substantial positive correlation between the proportion of U.S. Virgin Islanders and percentage of births to unmarried women in the United States with a correlation coefficient (R) of 0.504 and weighted average of 39.6%, a difference of 8.5%.
Births to Unmarried Women Correlation Summary
| Measurement | Trinidadian and Tobagonian | U.S. Virgin Islander |
| Minimum | 12.5% | 11.2% |
| Maximum | 100.0% | 100.0% |
| Range | 87.5% | 88.8% |
| Mean | 45.7% | 42.2% |
| Median | 39.9% | 39.6% |
| Interquartile 25% (IQ1) | 34.6% | 33.9% |
| Interquartile 75% (IQ3) | 52.0% | 47.4% |
| Interquartile Range (IQR) | 17.4% | 13.5% |
| Standard Deviation (Sample) | 19.0% | 16.2% |
| Standard Deviation (Population) | 18.8% | 16.1% |
Similar Demographics by Births to Unmarried Women
Demographics Similar to Trinidadians and Tobagonians by Births to Unmarried Women
In terms of births to unmarried women, the demographic groups most similar to Trinidadians and Tobagonians are Ottawa (36.5%, a difference of 0.0%), Immigrants from El Salvador (36.4%, a difference of 0.12%), American (36.4%, a difference of 0.17%), French American Indian (36.6%, a difference of 0.37%), and Nicaraguan (36.6%, a difference of 0.38%).
| Demographics | Rating | Rank | Births to Unmarried Women |
| Potawatomi | 0.2 /100 | #254 | Tragic 36.2% |
| Chickasaw | 0.2 /100 | #255 | Tragic 36.3% |
| Immigrants | Trinidad and Tobago | 0.2 /100 | #256 | Tragic 36.3% |
| Immigrants | Grenada | 0.2 /100 | #257 | Tragic 36.3% |
| Americans | 0.2 /100 | #258 | Tragic 36.4% |
| Immigrants | El Salvador | 0.2 /100 | #259 | Tragic 36.4% |
| Ottawa | 0.2 /100 | #260 | Tragic 36.5% |
| Trinidadians and Tobagonians | 0.2 /100 | #261 | Tragic 36.5% |
| French American Indians | 0.1 /100 | #262 | Tragic 36.6% |
| Nicaraguans | 0.1 /100 | #263 | Tragic 36.6% |
| Sub-Saharan Africans | 0.1 /100 | #264 | Tragic 36.7% |
| Cherokee | 0.1 /100 | #265 | Tragic 36.7% |
| Immigrants | Senegal | 0.1 /100 | #266 | Tragic 36.7% |
| Central Americans | 0.1 /100 | #267 | Tragic 36.7% |
| Comanche | 0.1 /100 | #268 | Tragic 36.7% |
Demographics Similar to U.S. Virgin Islanders by Births to Unmarried Women
In terms of births to unmarried women, the demographic groups most similar to U.S. Virgin Islanders are Immigrants from the Azores (39.6%, a difference of 0.020%), Immigrants from Dominica (39.5%, a difference of 0.25%), African (39.7%, a difference of 0.34%), Cuban (39.4%, a difference of 0.48%), and Aleut (39.3%, a difference of 0.60%).
| Demographics | Rating | Rank | Births to Unmarried Women |
| Immigrants | Haiti | 0.0 /100 | #305 | Tragic 38.9% |
| Central American Indians | 0.0 /100 | #306 | Tragic 39.0% |
| Immigrants | Honduras | 0.0 /100 | #307 | Tragic 39.3% |
| Aleuts | 0.0 /100 | #308 | Tragic 39.3% |
| Cubans | 0.0 /100 | #309 | Tragic 39.4% |
| Immigrants | Dominica | 0.0 /100 | #310 | Tragic 39.5% |
| Immigrants | Azores | 0.0 /100 | #311 | Tragic 39.6% |
| U.S. Virgin Islanders | 0.0 /100 | #312 | Tragic 39.6% |
| Africans | 0.0 /100 | #313 | Tragic 39.7% |
| Immigrants | Caribbean | 0.0 /100 | #314 | Tragic 39.8% |
| Dominicans | 0.0 /100 | #315 | Tragic 39.8% |
| Apache | 0.0 /100 | #316 | Tragic 39.9% |
| Immigrants | Dominican Republic | 0.0 /100 | #317 | Tragic 40.1% |
| Immigrants | Bahamas | 0.0 /100 | #318 | Tragic 40.1% |
| Yakama | 0.0 /100 | #319 | Tragic 40.3% |