Trinidadian and Tobagonian vs Immigrants from Scotland Births to Unmarried Women
COMPARE
Trinidadian and Tobagonian
Immigrants from Scotland
Births to Unmarried Women
Births to Unmarried Women Comparison
Trinidadians and Tobagonians
Immigrants from Scotland
36.5%
BIRTHS TO UNMARRIED WOMEN
0.2/ 100
METRIC RATING
261st/ 347
METRIC RANK
30.4%
BIRTHS TO UNMARRIED WOMEN
84.6/ 100
METRIC RATING
136th/ 347
METRIC RANK
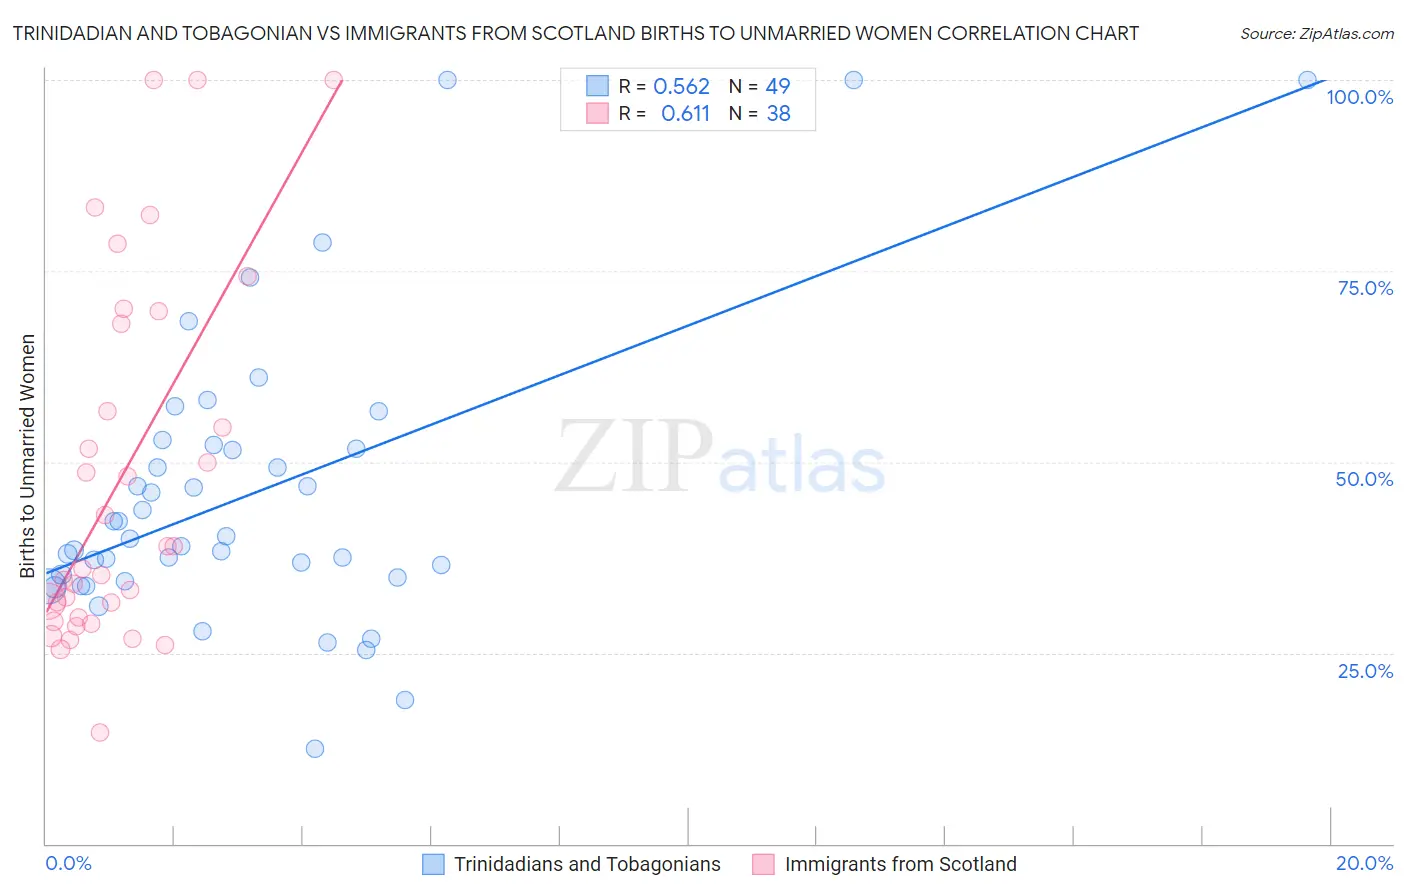
Trinidadian and Tobagonian vs Immigrants from Scotland Births to Unmarried Women Correlation Chart
The statistical analysis conducted on geographies consisting of 212,407,546 people shows a substantial positive correlation between the proportion of Trinidadians and Tobagonians and percentage of births to unmarried women in the United States with a correlation coefficient (R) of 0.562 and weighted average of 36.5%. Similarly, the statistical analysis conducted on geographies consisting of 185,682,115 people shows a significant positive correlation between the proportion of Immigrants from Scotland and percentage of births to unmarried women in the United States with a correlation coefficient (R) of 0.611 and weighted average of 30.4%, a difference of 20.0%.
Births to Unmarried Women Correlation Summary
| Measurement | Trinidadian and Tobagonian | Immigrants from Scotland |
| Minimum | 12.5% | 14.6% |
| Maximum | 100.0% | 100.0% |
| Range | 87.5% | 85.4% |
| Mean | 45.7% | 47.9% |
| Median | 39.9% | 37.5% |
| Interquartile 25% (IQ1) | 34.6% | 29.6% |
| Interquartile 75% (IQ3) | 52.0% | 68.2% |
| Interquartile Range (IQR) | 17.4% | 38.6% |
| Standard Deviation (Sample) | 19.0% | 23.6% |
| Standard Deviation (Population) | 18.8% | 23.3% |
Similar Demographics by Births to Unmarried Women
Demographics Similar to Trinidadians and Tobagonians by Births to Unmarried Women
In terms of births to unmarried women, the demographic groups most similar to Trinidadians and Tobagonians are Ottawa (36.5%, a difference of 0.0%), Immigrants from El Salvador (36.4%, a difference of 0.12%), American (36.4%, a difference of 0.17%), French American Indian (36.6%, a difference of 0.37%), and Nicaraguan (36.6%, a difference of 0.38%).
| Demographics | Rating | Rank | Births to Unmarried Women |
| Potawatomi | 0.2 /100 | #254 | Tragic 36.2% |
| Chickasaw | 0.2 /100 | #255 | Tragic 36.3% |
| Immigrants | Trinidad and Tobago | 0.2 /100 | #256 | Tragic 36.3% |
| Immigrants | Grenada | 0.2 /100 | #257 | Tragic 36.3% |
| Americans | 0.2 /100 | #258 | Tragic 36.4% |
| Immigrants | El Salvador | 0.2 /100 | #259 | Tragic 36.4% |
| Ottawa | 0.2 /100 | #260 | Tragic 36.5% |
| Trinidadians and Tobagonians | 0.2 /100 | #261 | Tragic 36.5% |
| French American Indians | 0.1 /100 | #262 | Tragic 36.6% |
| Nicaraguans | 0.1 /100 | #263 | Tragic 36.6% |
| Sub-Saharan Africans | 0.1 /100 | #264 | Tragic 36.7% |
| Cherokee | 0.1 /100 | #265 | Tragic 36.7% |
| Immigrants | Senegal | 0.1 /100 | #266 | Tragic 36.7% |
| Central Americans | 0.1 /100 | #267 | Tragic 36.7% |
| Comanche | 0.1 /100 | #268 | Tragic 36.7% |
Demographics Similar to Immigrants from Scotland by Births to Unmarried Women
In terms of births to unmarried women, the demographic groups most similar to Immigrants from Scotland are Brazilian (30.4%, a difference of 0.030%), Immigrants from South Eastern Asia (30.4%, a difference of 0.11%), Immigrants from Morocco (30.4%, a difference of 0.12%), Immigrants from Philippines (30.4%, a difference of 0.13%), and Puget Sound Salish (30.4%, a difference of 0.13%).
| Demographics | Rating | Rank | Births to Unmarried Women |
| Immigrants | Spain | 85.8 /100 | #129 | Excellent 30.3% |
| Immigrants | Bosnia and Herzegovina | 85.7 /100 | #130 | Excellent 30.3% |
| Immigrants | Zimbabwe | 85.7 /100 | #131 | Excellent 30.3% |
| New Zealanders | 85.5 /100 | #132 | Excellent 30.3% |
| Immigrants | Morocco | 85.2 /100 | #133 | Excellent 30.4% |
| Immigrants | South Eastern Asia | 85.2 /100 | #134 | Excellent 30.4% |
| Brazilians | 84.8 /100 | #135 | Excellent 30.4% |
| Immigrants | Scotland | 84.6 /100 | #136 | Excellent 30.4% |
| Immigrants | Philippines | 83.9 /100 | #137 | Excellent 30.4% |
| Puget Sound Salish | 83.9 /100 | #138 | Excellent 30.4% |
| Immigrants | Canada | 83.7 /100 | #139 | Excellent 30.4% |
| Swiss | 83.1 /100 | #140 | Excellent 30.5% |
| Pakistanis | 83.0 /100 | #141 | Excellent 30.5% |
| South Africans | 82.7 /100 | #142 | Excellent 30.5% |
| Immigrants | Uganda | 82.6 /100 | #143 | Excellent 30.5% |