Immigrants from Bangladesh vs Immigrants from Yemen Average Family Size
COMPARE
Immigrants from Bangladesh
Immigrants from Yemen
Average Family Size
Average Family Size Comparison
Immigrants from Bangladesh
Immigrants from Yemen
3.36
AVERAGE FAMILY SIZE
100.0/ 100
METRIC RATING
50th/ 347
METRIC RANK
3.60
AVERAGE FAMILY SIZE
100.0/ 100
METRIC RATING
8th/ 347
METRIC RANK
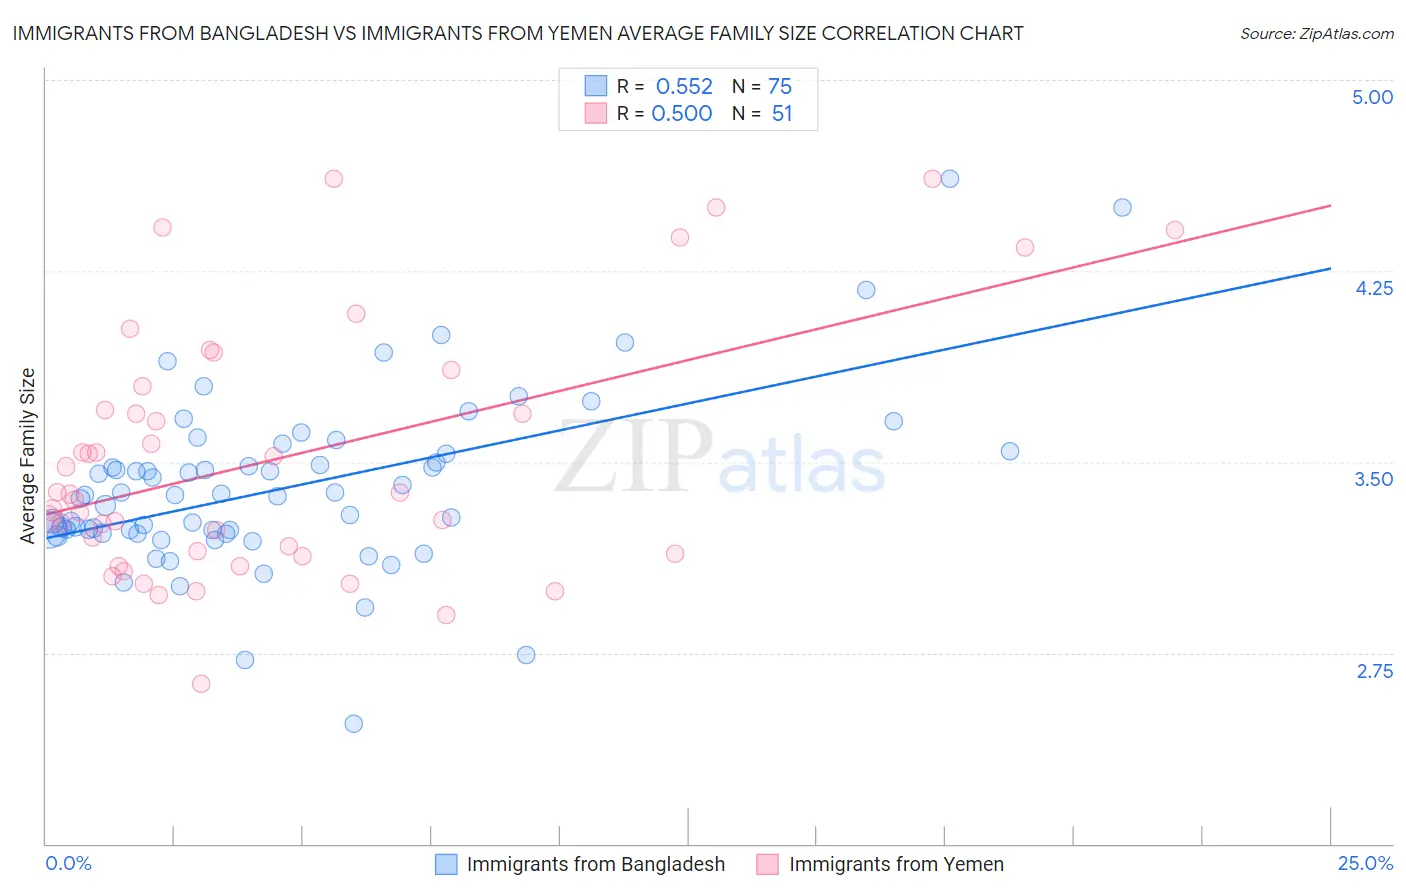
Immigrants from Bangladesh vs Immigrants from Yemen Average Family Size Correlation Chart
The statistical analysis conducted on geographies consisting of 203,581,680 people shows a substantial positive correlation between the proportion of Immigrants from Bangladesh and average family size in the United States with a correlation coefficient (R) of 0.552 and weighted average of 3.36. Similarly, the statistical analysis conducted on geographies consisting of 82,433,611 people shows a moderate positive correlation between the proportion of Immigrants from Yemen and average family size in the United States with a correlation coefficient (R) of 0.500 and weighted average of 3.60, a difference of 6.9%.
Average Family Size Correlation Summary
| Measurement | Immigrants from Bangladesh | Immigrants from Yemen |
| Minimum | 2.47 | 2.63 |
| Maximum | 4.61 | 4.61 |
| Range | 2.14 | 1.98 |
| Mean | 3.40 | 3.51 |
| Median | 3.37 | 3.37 |
| Interquartile 25% (IQ1) | 3.22 | 3.14 |
| Interquartile 75% (IQ3) | 3.53 | 3.80 |
| Interquartile Range (IQR) | 0.31 | 0.66 |
| Standard Deviation (Sample) | 0.34 | 0.49 |
| Standard Deviation (Population) | 0.34 | 0.49 |
Similar Demographics by Average Family Size
Demographics Similar to Immigrants from Bangladesh by Average Family Size
In terms of average family size, the demographic groups most similar to Immigrants from Bangladesh are Nicaraguan (3.36, a difference of 0.070%), Fijian (3.36, a difference of 0.13%), Bangladeshi (3.37, a difference of 0.14%), Korean (3.36, a difference of 0.16%), and Immigrants from South Eastern Asia (3.36, a difference of 0.18%).
| Demographics | Rating | Rank | Average Family Size |
| Immigrants | Philippines | 100.0 /100 | #43 | Exceptional 3.37 |
| Alaska Natives | 100.0 /100 | #44 | Exceptional 3.37 |
| Shoshone | 100.0 /100 | #45 | Exceptional 3.37 |
| Haitians | 100.0 /100 | #46 | Exceptional 3.37 |
| Vietnamese | 100.0 /100 | #47 | Exceptional 3.37 |
| Immigrants | Nicaragua | 100.0 /100 | #48 | Exceptional 3.37 |
| Bangladeshis | 100.0 /100 | #49 | Exceptional 3.37 |
| Immigrants | Bangladesh | 100.0 /100 | #50 | Exceptional 3.36 |
| Nicaraguans | 100.0 /100 | #51 | Exceptional 3.36 |
| Fijians | 100.0 /100 | #52 | Exceptional 3.36 |
| Koreans | 100.0 /100 | #53 | Exceptional 3.36 |
| Immigrants | South Eastern Asia | 100.0 /100 | #54 | Exceptional 3.36 |
| Immigrants | Honduras | 100.0 /100 | #55 | Exceptional 3.36 |
| Immigrants | Dominican Republic | 100.0 /100 | #56 | Exceptional 3.35 |
| Sri Lankans | 100.0 /100 | #57 | Exceptional 3.35 |
Demographics Similar to Immigrants from Yemen by Average Family Size
In terms of average family size, the demographic groups most similar to Immigrants from Yemen are Hopi (3.60, a difference of 0.010%), Spanish American Indian (3.58, a difference of 0.36%), Inupiat (3.63, a difference of 0.87%), Arapaho (3.64, a difference of 1.1%), and Navajo (3.65, a difference of 1.3%).
| Demographics | Rating | Rank | Average Family Size |
| Yup'ik | 100 /100 | #1 | Exceptional 4.00 |
| Crow | 100 /100 | #2 | Exceptional 3.82 |
| Pueblo | 100 /100 | #3 | Exceptional 3.79 |
| Pima | 100 /100 | #4 | Exceptional 3.75 |
| Navajo | 100.0 /100 | #5 | Exceptional 3.65 |
| Arapaho | 100.0 /100 | #6 | Exceptional 3.64 |
| Inupiat | 100.0 /100 | #7 | Exceptional 3.63 |
| Immigrants | Yemen | 100.0 /100 | #8 | Exceptional 3.60 |
| Hopi | 100.0 /100 | #9 | Exceptional 3.60 |
| Spanish American Indians | 100.0 /100 | #10 | Exceptional 3.58 |
| Tohono O'odham | 100.0 /100 | #11 | Exceptional 3.53 |
| Immigrants | Mexico | 100.0 /100 | #12 | Exceptional 3.52 |
| Sioux | 100.0 /100 | #13 | Exceptional 3.52 |
| Immigrants | Central America | 100.0 /100 | #14 | Exceptional 3.49 |
| Tongans | 100.0 /100 | #15 | Exceptional 3.49 |