Tlingit-Haida vs Polish Single Father Households
COMPARE
Tlingit-Haida
Polish
Single Father Households
Single Father Households Comparison
Tlingit-Haida
Poles
2.7%
SINGLE FATHER HOUSEHOLDS
0.0/ 100
METRIC RATING
289th/ 347
METRIC RANK
2.2%
SINGLE FATHER HOUSEHOLDS
96.5/ 100
METRIC RATING
132nd/ 347
METRIC RANK
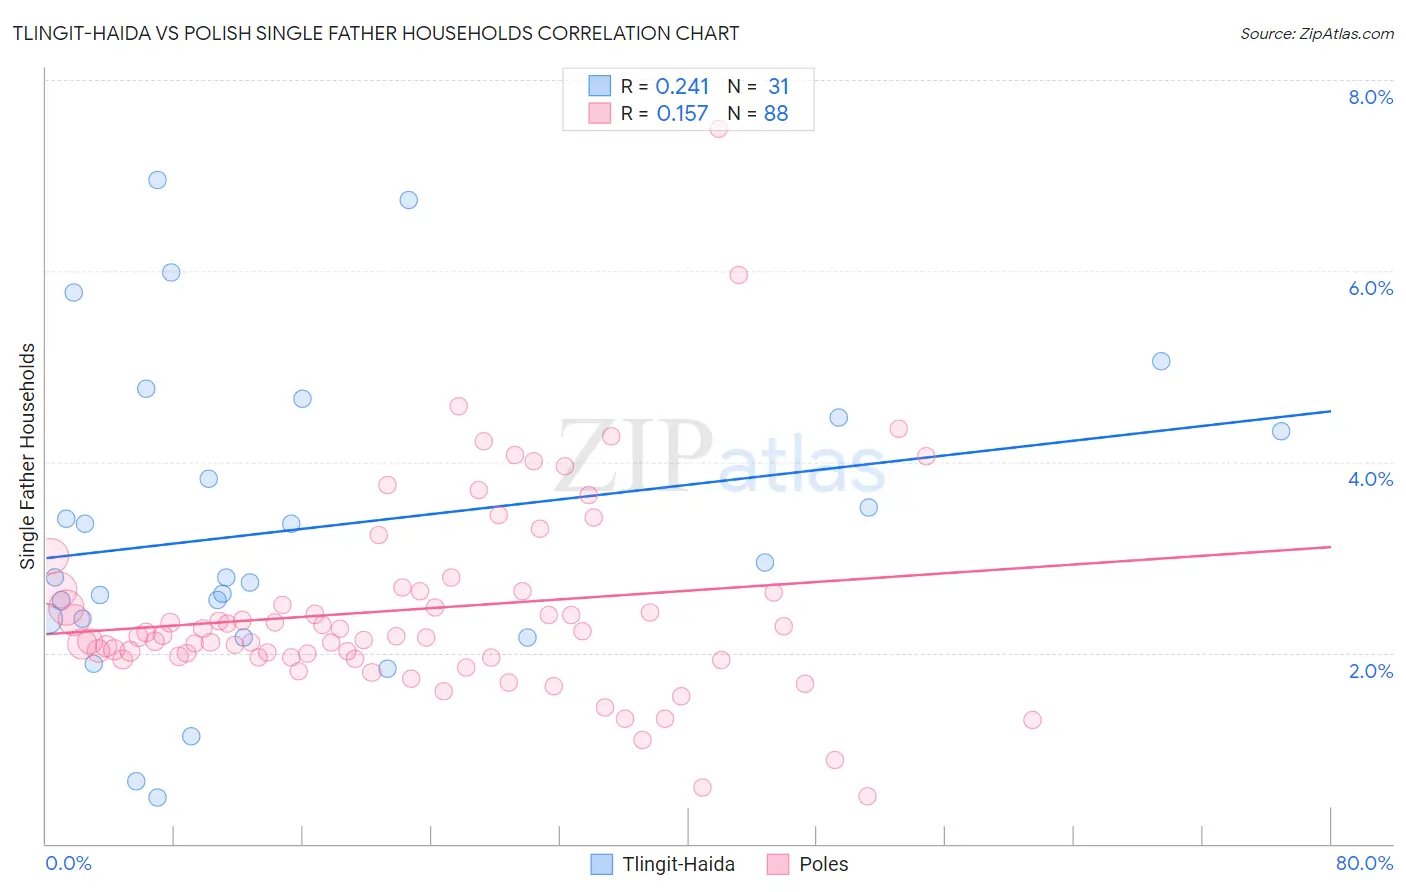
Tlingit-Haida vs Polish Single Father Households Correlation Chart
The statistical analysis conducted on geographies consisting of 60,729,668 people shows a weak positive correlation between the proportion of Tlingit-Haida and percentage of single father households in the United States with a correlation coefficient (R) of 0.241 and weighted average of 2.7%. Similarly, the statistical analysis conducted on geographies consisting of 546,814,077 people shows a poor positive correlation between the proportion of Poles and percentage of single father households in the United States with a correlation coefficient (R) of 0.157 and weighted average of 2.2%, a difference of 21.8%.
Single Father Households Correlation Summary
| Measurement | Tlingit-Haida | Polish |
| Minimum | 0.49% | 0.50% |
| Maximum | 6.9% | 7.5% |
| Range | 6.5% | 7.0% |
| Mean | 3.3% | 2.5% |
| Median | 2.8% | 2.2% |
| Interquartile 25% (IQ1) | 2.4% | 2.0% |
| Interquartile 75% (IQ3) | 4.5% | 2.6% |
| Interquartile Range (IQR) | 2.1% | 0.69% |
| Standard Deviation (Sample) | 1.6% | 1.1% |
| Standard Deviation (Population) | 1.6% | 1.1% |
Similar Demographics by Single Father Households
Demographics Similar to Tlingit-Haida by Single Father Households
In terms of single father households, the demographic groups most similar to Tlingit-Haida are Immigrants from Cambodia (2.7%, a difference of 0.060%), Central American Indian (2.7%, a difference of 0.31%), Puget Sound Salish (2.7%, a difference of 0.45%), Ottawa (2.7%, a difference of 0.47%), and Immigrants from Cuba (2.7%, a difference of 0.47%).
| Demographics | Rating | Rank | Single Father Households |
| Dutch West Indians | 0.1 /100 | #282 | Tragic 2.6% |
| Immigrants | Nicaragua | 0.1 /100 | #283 | Tragic 2.7% |
| Hawaiians | 0.1 /100 | #284 | Tragic 2.7% |
| Ottawa | 0.1 /100 | #285 | Tragic 2.7% |
| Immigrants | Cuba | 0.1 /100 | #286 | Tragic 2.7% |
| Central American Indians | 0.0 /100 | #287 | Tragic 2.7% |
| Immigrants | Cambodia | 0.0 /100 | #288 | Tragic 2.7% |
| Tlingit-Haida | 0.0 /100 | #289 | Tragic 2.7% |
| Puget Sound Salish | 0.0 /100 | #290 | Tragic 2.7% |
| Blackfeet | 0.0 /100 | #291 | Tragic 2.7% |
| Choctaw | 0.0 /100 | #292 | Tragic 2.7% |
| Immigrants | Fiji | 0.0 /100 | #293 | Tragic 2.7% |
| Malaysians | 0.0 /100 | #294 | Tragic 2.7% |
| Chickasaw | 0.0 /100 | #295 | Tragic 2.8% |
| Japanese | 0.0 /100 | #296 | Tragic 2.8% |
Demographics Similar to Poles by Single Father Households
In terms of single father households, the demographic groups most similar to Poles are Immigrants from Jordan (2.2%, a difference of 0.020%), Immigrants from Chile (2.2%, a difference of 0.070%), Taiwanese (2.2%, a difference of 0.12%), Serbian (2.2%, a difference of 0.19%), and Immigrants from England (2.2%, a difference of 0.20%).
| Demographics | Rating | Rank | Single Father Households |
| Immigrants | Indonesia | 97.4 /100 | #125 | Exceptional 2.2% |
| Moroccans | 96.9 /100 | #126 | Exceptional 2.2% |
| Jordanians | 96.9 /100 | #127 | Exceptional 2.2% |
| Immigrants | England | 96.8 /100 | #128 | Exceptional 2.2% |
| Serbians | 96.8 /100 | #129 | Exceptional 2.2% |
| Immigrants | Chile | 96.7 /100 | #130 | Exceptional 2.2% |
| Immigrants | Jordan | 96.6 /100 | #131 | Exceptional 2.2% |
| Poles | 96.5 /100 | #132 | Exceptional 2.2% |
| Taiwanese | 96.3 /100 | #133 | Exceptional 2.2% |
| Zimbabweans | 95.1 /100 | #134 | Exceptional 2.2% |
| Syrians | 94.8 /100 | #135 | Exceptional 2.2% |
| Chileans | 94.5 /100 | #136 | Exceptional 2.2% |
| Austrians | 94.2 /100 | #137 | Exceptional 2.2% |
| West Indians | 94.1 /100 | #138 | Exceptional 2.2% |
| Brazilians | 92.8 /100 | #139 | Exceptional 2.2% |