Portuguese vs Immigrants from Germany Single Father Households
COMPARE
Portuguese
Immigrants from Germany
Single Father Households
Single Father Households Comparison
Portuguese
Immigrants from Germany
2.5%
SINGLE FATHER HOUSEHOLDS
4.1/ 100
METRIC RATING
241st/ 347
METRIC RANK
2.3%
SINGLE FATHER HOUSEHOLDS
82.8/ 100
METRIC RATING
153rd/ 347
METRIC RANK
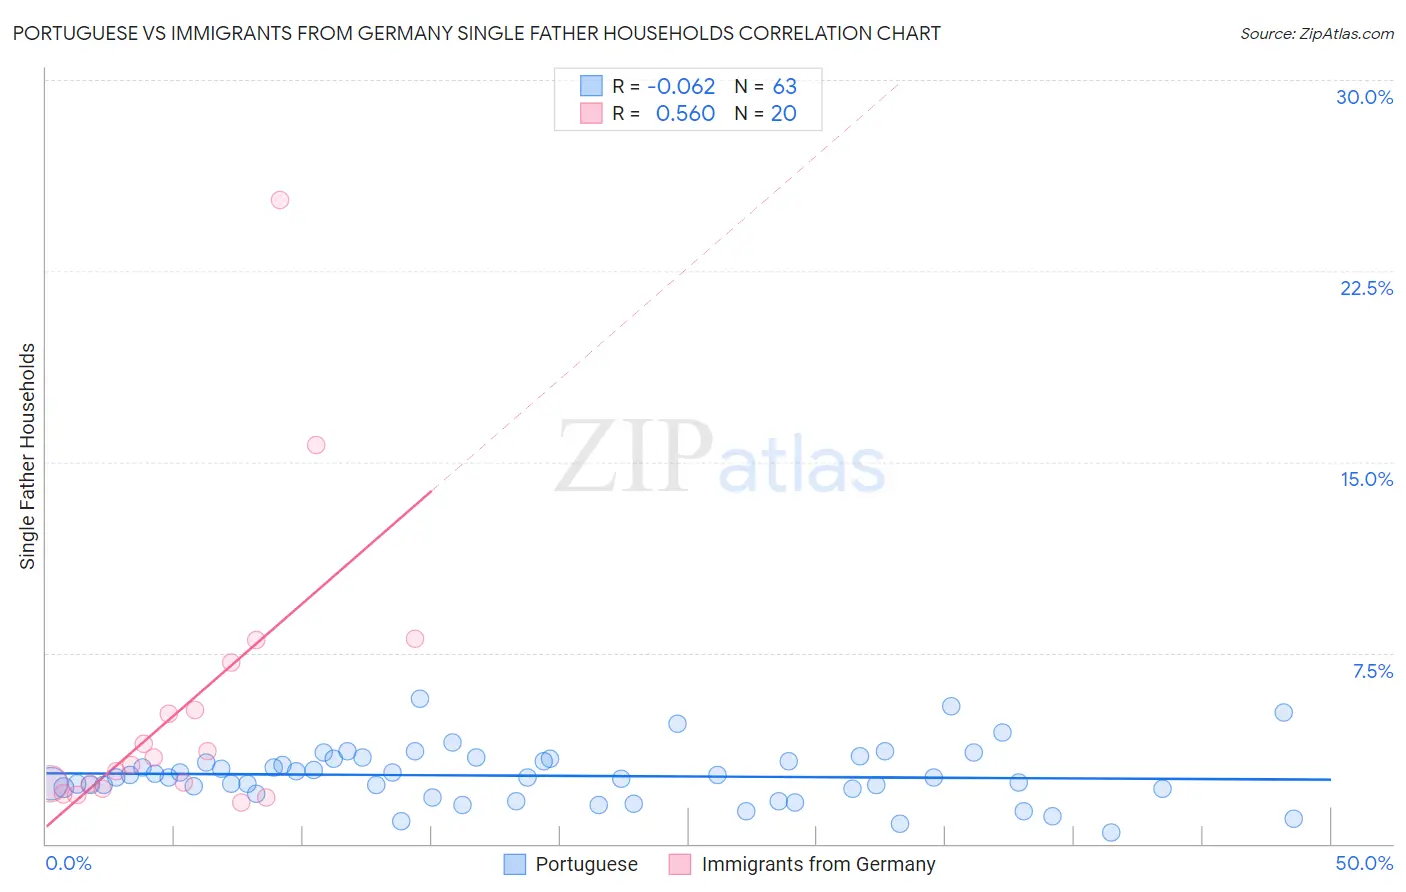
Portuguese vs Immigrants from Germany Single Father Households Correlation Chart
The statistical analysis conducted on geographies consisting of 444,369,792 people shows a slight negative correlation between the proportion of Portuguese and percentage of single father households in the United States with a correlation coefficient (R) of -0.062 and weighted average of 2.5%. Similarly, the statistical analysis conducted on geographies consisting of 458,347,469 people shows a substantial positive correlation between the proportion of Immigrants from Germany and percentage of single father households in the United States with a correlation coefficient (R) of 0.560 and weighted average of 2.3%, a difference of 8.9%.
Single Father Households Correlation Summary
| Measurement | Portuguese | Immigrants from Germany |
| Minimum | 0.46% | 1.6% |
| Maximum | 5.7% | 25.3% |
| Range | 5.2% | 23.6% |
| Mean | 2.7% | 5.4% |
| Median | 2.6% | 3.2% |
| Interquartile 25% (IQ1) | 2.2% | 2.3% |
| Interquartile 75% (IQ3) | 3.3% | 6.2% |
| Interquartile Range (IQR) | 1.2% | 3.9% |
| Standard Deviation (Sample) | 1.1% | 5.7% |
| Standard Deviation (Population) | 1.1% | 5.6% |
Similar Demographics by Single Father Households
Demographics Similar to Portuguese by Single Father Households
In terms of single father households, the demographic groups most similar to Portuguese are Osage (2.5%, a difference of 0.030%), Immigrants from Dominica (2.5%, a difference of 0.26%), Spaniard (2.5%, a difference of 0.50%), Immigrants from Oceania (2.5%, a difference of 0.62%), and Immigrants from Sierra Leone (2.5%, a difference of 0.63%).
| Demographics | Rating | Rank | Single Father Households |
| Africans | 6.3 /100 | #234 | Tragic 2.5% |
| Immigrants | Immigrants | 6.3 /100 | #235 | Tragic 2.5% |
| Cajuns | 6.1 /100 | #236 | Tragic 2.5% |
| Sierra Leoneans | 5.9 /100 | #237 | Tragic 2.5% |
| Immigrants | Sierra Leone | 5.8 /100 | #238 | Tragic 2.5% |
| Immigrants | Oceania | 5.8 /100 | #239 | Tragic 2.5% |
| Immigrants | Dominica | 4.8 /100 | #240 | Tragic 2.5% |
| Portuguese | 4.1 /100 | #241 | Tragic 2.5% |
| Osage | 4.1 /100 | #242 | Tragic 2.5% |
| Spaniards | 3.1 /100 | #243 | Tragic 2.5% |
| Immigrants | Middle Africa | 2.8 /100 | #244 | Tragic 2.5% |
| Basques | 2.5 /100 | #245 | Tragic 2.5% |
| Native Hawaiians | 2.5 /100 | #246 | Tragic 2.5% |
| Delaware | 2.5 /100 | #247 | Tragic 2.5% |
| Bahamians | 2.4 /100 | #248 | Tragic 2.5% |
Demographics Similar to Immigrants from Germany by Single Father Households
In terms of single father households, the demographic groups most similar to Immigrants from Germany are Immigrants from Venezuela (2.3%, a difference of 0.050%), Bolivian (2.3%, a difference of 0.22%), European (2.3%, a difference of 0.24%), Immigrants from Syria (2.3%, a difference of 0.28%), and Immigrants from South America (2.3%, a difference of 0.36%).
| Demographics | Rating | Rank | Single Father Households |
| Northern Europeans | 89.8 /100 | #146 | Excellent 2.2% |
| Slavs | 88.9 /100 | #147 | Excellent 2.2% |
| South American Indians | 88.5 /100 | #148 | Excellent 2.3% |
| Senegalese | 88.4 /100 | #149 | Excellent 2.3% |
| Venezuelans | 86.2 /100 | #150 | Excellent 2.3% |
| Immigrants | Syria | 84.8 /100 | #151 | Excellent 2.3% |
| Immigrants | Venezuela | 83.2 /100 | #152 | Excellent 2.3% |
| Immigrants | Germany | 82.8 /100 | #153 | Excellent 2.3% |
| Bolivians | 81.0 /100 | #154 | Excellent 2.3% |
| Europeans | 80.9 /100 | #155 | Excellent 2.3% |
| Immigrants | South America | 79.9 /100 | #156 | Good 2.3% |
| Canadians | 79.7 /100 | #157 | Good 2.3% |
| Immigrants | Senegal | 79.4 /100 | #158 | Good 2.3% |
| Immigrants | West Indies | 77.9 /100 | #159 | Good 2.3% |
| Immigrants | Bolivia | 76.3 /100 | #160 | Good 2.3% |