Tongan vs Immigrants from Germany Single Father Households
COMPARE
Tongan
Immigrants from Germany
Single Father Households
Single Father Households Comparison
Tongans
Immigrants from Germany
2.5%
SINGLE FATHER HOUSEHOLDS
1.5/ 100
METRIC RATING
255th/ 347
METRIC RANK
2.3%
SINGLE FATHER HOUSEHOLDS
82.8/ 100
METRIC RATING
153rd/ 347
METRIC RANK
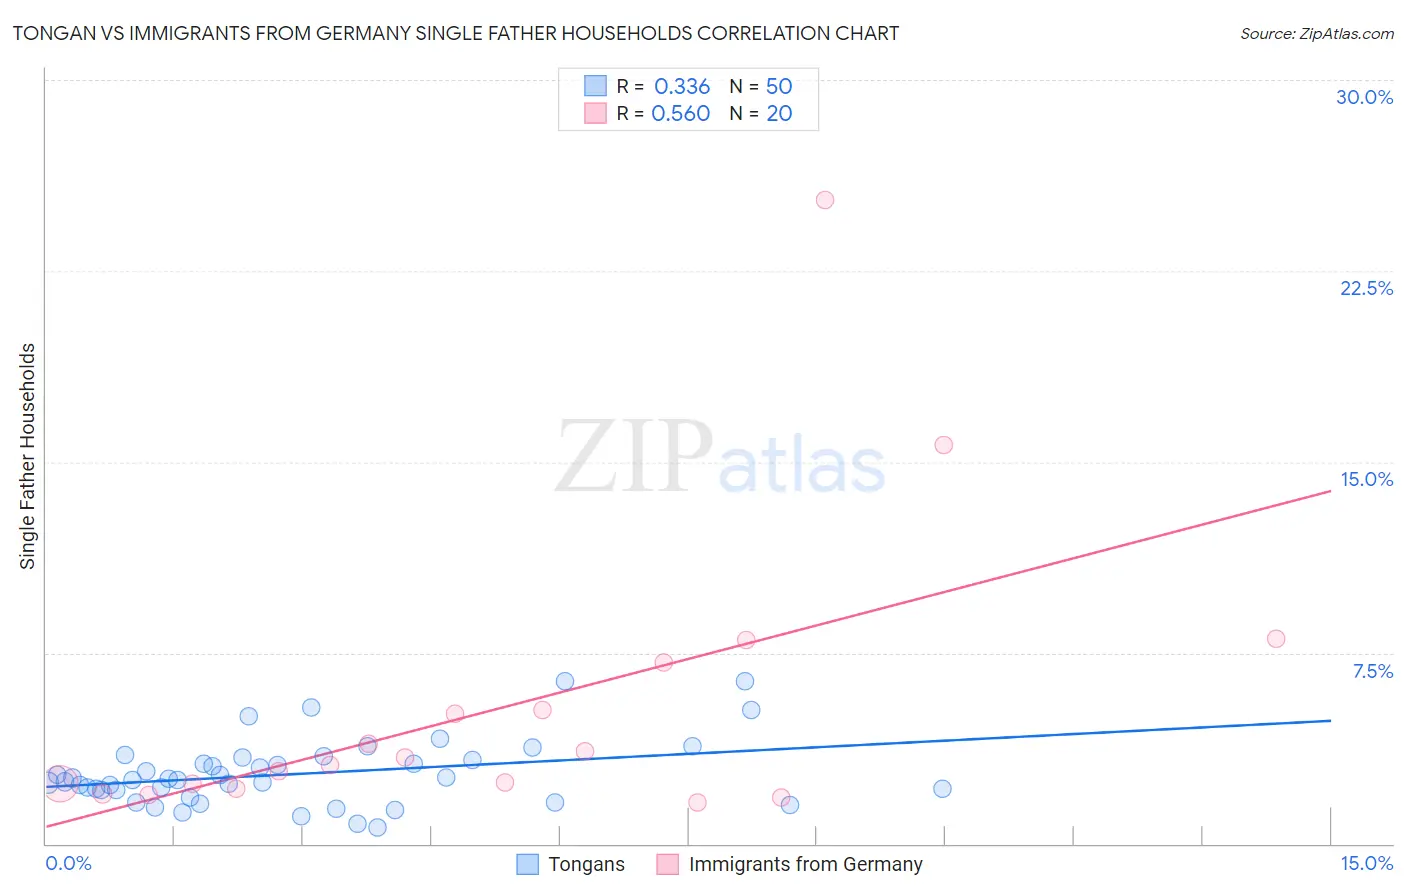
Tongan vs Immigrants from Germany Single Father Households Correlation Chart
The statistical analysis conducted on geographies consisting of 102,674,538 people shows a mild positive correlation between the proportion of Tongans and percentage of single father households in the United States with a correlation coefficient (R) of 0.336 and weighted average of 2.5%. Similarly, the statistical analysis conducted on geographies consisting of 458,347,469 people shows a substantial positive correlation between the proportion of Immigrants from Germany and percentage of single father households in the United States with a correlation coefficient (R) of 0.560 and weighted average of 2.3%, a difference of 11.0%.
Single Father Households Correlation Summary
| Measurement | Tongan | Immigrants from Germany |
| Minimum | 0.63% | 1.6% |
| Maximum | 6.4% | 25.3% |
| Range | 5.8% | 23.6% |
| Mean | 2.7% | 5.4% |
| Median | 2.5% | 3.2% |
| Interquartile 25% (IQ1) | 2.1% | 2.3% |
| Interquartile 75% (IQ3) | 3.3% | 6.2% |
| Interquartile Range (IQR) | 1.2% | 3.9% |
| Standard Deviation (Sample) | 1.3% | 5.7% |
| Standard Deviation (Population) | 1.3% | 5.6% |
Similar Demographics by Single Father Households
Demographics Similar to Tongans by Single Father Households
In terms of single father households, the demographic groups most similar to Tongans are Potawatomi (2.5%, a difference of 0.060%), Immigrants from Congo (2.5%, a difference of 0.34%), Immigrants from Thailand (2.5%, a difference of 0.41%), Spanish (2.5%, a difference of 0.43%), and Immigrants from Somalia (2.5%, a difference of 0.45%).
| Demographics | Rating | Rank | Single Father Households |
| Bahamians | 2.4 /100 | #248 | Tragic 2.5% |
| Immigrants | Cameroon | 2.3 /100 | #249 | Tragic 2.5% |
| Somalis | 2.1 /100 | #250 | Tragic 2.5% |
| Liberians | 2.0 /100 | #251 | Tragic 2.5% |
| Immigrants | Eritrea | 2.0 /100 | #252 | Tragic 2.5% |
| Immigrants | Somalia | 1.9 /100 | #253 | Tragic 2.5% |
| Immigrants | Thailand | 1.8 /100 | #254 | Tragic 2.5% |
| Tongans | 1.5 /100 | #255 | Tragic 2.5% |
| Potawatomi | 1.4 /100 | #256 | Tragic 2.5% |
| Immigrants | Congo | 1.2 /100 | #257 | Tragic 2.5% |
| Spanish | 1.1 /100 | #258 | Tragic 2.5% |
| Comanche | 1.0 /100 | #259 | Tragic 2.5% |
| Immigrants | Caribbean | 1.0 /100 | #260 | Tragic 2.5% |
| Immigrants | Belize | 0.9 /100 | #261 | Tragic 2.5% |
| Immigrants | Liberia | 0.8 /100 | #262 | Tragic 2.5% |
Demographics Similar to Immigrants from Germany by Single Father Households
In terms of single father households, the demographic groups most similar to Immigrants from Germany are Immigrants from Venezuela (2.3%, a difference of 0.050%), Bolivian (2.3%, a difference of 0.22%), European (2.3%, a difference of 0.24%), Immigrants from Syria (2.3%, a difference of 0.28%), and Immigrants from South America (2.3%, a difference of 0.36%).
| Demographics | Rating | Rank | Single Father Households |
| Northern Europeans | 89.8 /100 | #146 | Excellent 2.2% |
| Slavs | 88.9 /100 | #147 | Excellent 2.2% |
| South American Indians | 88.5 /100 | #148 | Excellent 2.3% |
| Senegalese | 88.4 /100 | #149 | Excellent 2.3% |
| Venezuelans | 86.2 /100 | #150 | Excellent 2.3% |
| Immigrants | Syria | 84.8 /100 | #151 | Excellent 2.3% |
| Immigrants | Venezuela | 83.2 /100 | #152 | Excellent 2.3% |
| Immigrants | Germany | 82.8 /100 | #153 | Excellent 2.3% |
| Bolivians | 81.0 /100 | #154 | Excellent 2.3% |
| Europeans | 80.9 /100 | #155 | Excellent 2.3% |
| Immigrants | South America | 79.9 /100 | #156 | Good 2.3% |
| Canadians | 79.7 /100 | #157 | Good 2.3% |
| Immigrants | Senegal | 79.4 /100 | #158 | Good 2.3% |
| Immigrants | West Indies | 77.9 /100 | #159 | Good 2.3% |
| Immigrants | Bolivia | 76.3 /100 | #160 | Good 2.3% |