Taiwanese vs Immigrants from Germany Single Father Households
COMPARE
Taiwanese
Immigrants from Germany
Single Father Households
Single Father Households Comparison
Taiwanese
Immigrants from Germany
2.2%
SINGLE FATHER HOUSEHOLDS
96.3/ 100
METRIC RATING
133rd/ 347
METRIC RANK
2.3%
SINGLE FATHER HOUSEHOLDS
82.8/ 100
METRIC RATING
153rd/ 347
METRIC RANK
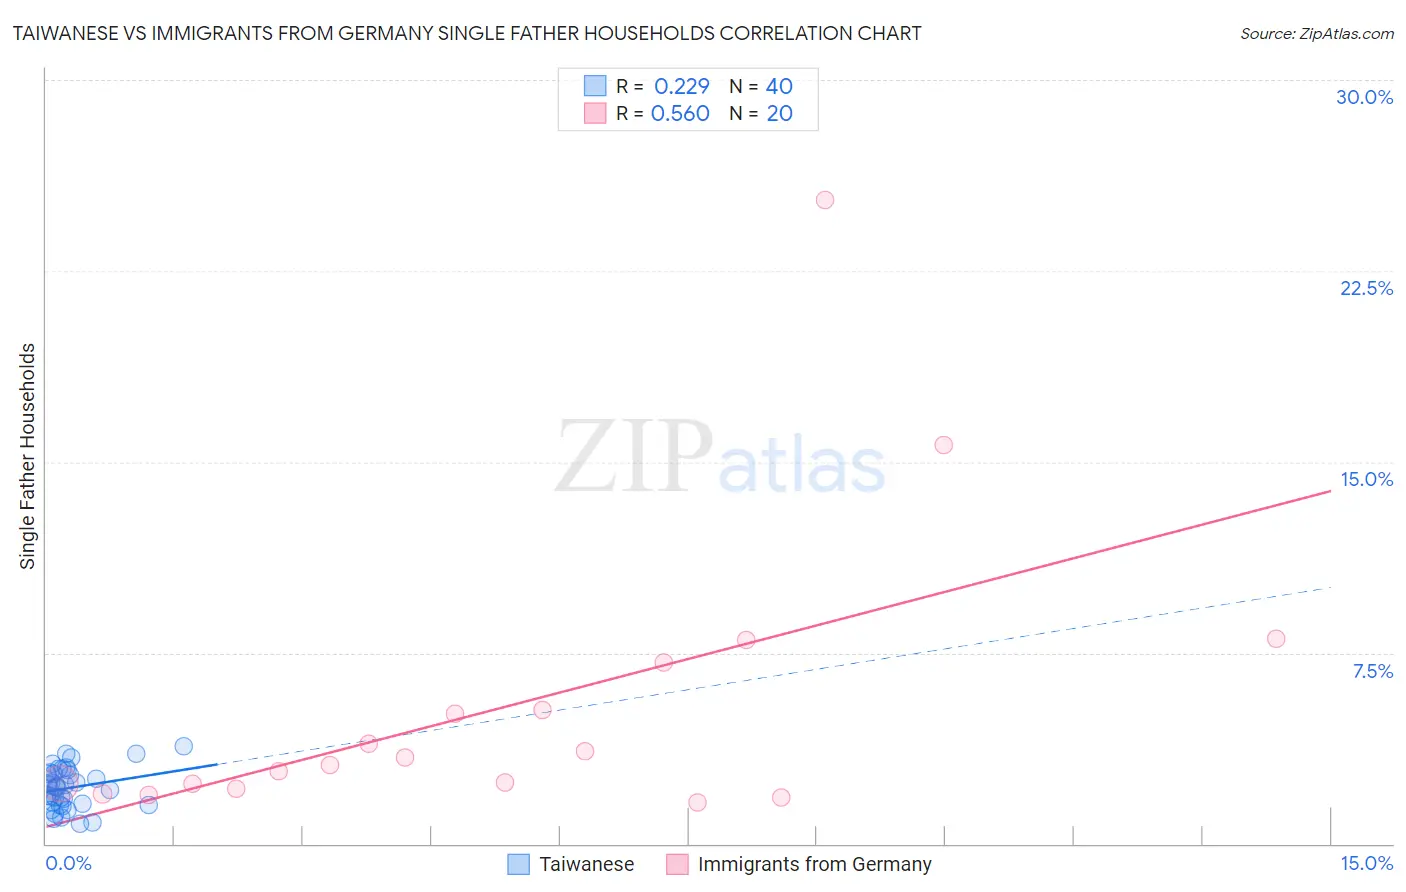
Taiwanese vs Immigrants from Germany Single Father Households Correlation Chart
The statistical analysis conducted on geographies consisting of 31,679,530 people shows a weak positive correlation between the proportion of Taiwanese and percentage of single father households in the United States with a correlation coefficient (R) of 0.229 and weighted average of 2.2%. Similarly, the statistical analysis conducted on geographies consisting of 458,347,469 people shows a substantial positive correlation between the proportion of Immigrants from Germany and percentage of single father households in the United States with a correlation coefficient (R) of 0.560 and weighted average of 2.3%, a difference of 3.3%.
Single Father Households Correlation Summary
| Measurement | Taiwanese | Immigrants from Germany |
| Minimum | 0.77% | 1.6% |
| Maximum | 3.9% | 25.3% |
| Range | 3.1% | 23.6% |
| Mean | 2.2% | 5.4% |
| Median | 2.2% | 3.2% |
| Interquartile 25% (IQ1) | 1.6% | 2.3% |
| Interquartile 75% (IQ3) | 2.8% | 6.2% |
| Interquartile Range (IQR) | 1.2% | 3.9% |
| Standard Deviation (Sample) | 0.79% | 5.7% |
| Standard Deviation (Population) | 0.78% | 5.6% |
Demographics Similar to Taiwanese and Immigrants from Germany by Single Father Households
In terms of single father households, the demographic groups most similar to Taiwanese are Zimbabwean (2.2%, a difference of 0.60%), Syrian (2.2%, a difference of 0.71%), Chilean (2.2%, a difference of 0.83%), Austrian (2.2%, a difference of 0.94%), and West Indian (2.2%, a difference of 0.97%). Similarly, the demographic groups most similar to Immigrants from Germany are Immigrants from Venezuela (2.3%, a difference of 0.050%), Immigrants from Syria (2.3%, a difference of 0.28%), Venezuelan (2.3%, a difference of 0.50%), Senegalese (2.3%, a difference of 0.88%), and South American Indian (2.3%, a difference of 0.89%).
| Demographics | Rating | Rank | Single Father Households |
| Taiwanese | 96.3 /100 | #133 | Exceptional 2.2% |
| Zimbabweans | 95.1 /100 | #134 | Exceptional 2.2% |
| Syrians | 94.8 /100 | #135 | Exceptional 2.2% |
| Chileans | 94.5 /100 | #136 | Exceptional 2.2% |
| Austrians | 94.2 /100 | #137 | Exceptional 2.2% |
| West Indians | 94.1 /100 | #138 | Exceptional 2.2% |
| Brazilians | 92.8 /100 | #139 | Exceptional 2.2% |
| British | 92.8 /100 | #140 | Exceptional 2.2% |
| Laotians | 92.5 /100 | #141 | Exceptional 2.2% |
| Luxembourgers | 92.3 /100 | #142 | Exceptional 2.2% |
| Immigrants | Nepal | 92.1 /100 | #143 | Exceptional 2.2% |
| Slovaks | 90.7 /100 | #144 | Exceptional 2.2% |
| Immigrants | Zimbabwe | 90.2 /100 | #145 | Exceptional 2.2% |
| Northern Europeans | 89.8 /100 | #146 | Excellent 2.2% |
| Slavs | 88.9 /100 | #147 | Excellent 2.2% |
| South American Indians | 88.5 /100 | #148 | Excellent 2.3% |
| Senegalese | 88.4 /100 | #149 | Excellent 2.3% |
| Venezuelans | 86.2 /100 | #150 | Excellent 2.3% |
| Immigrants | Syria | 84.8 /100 | #151 | Excellent 2.3% |
| Immigrants | Venezuela | 83.2 /100 | #152 | Excellent 2.3% |
| Immigrants | Germany | 82.8 /100 | #153 | Excellent 2.3% |