Tlingit-Haida vs New Zealander Single Father Households
COMPARE
Tlingit-Haida
New Zealander
Single Father Households
Single Father Households Comparison
Tlingit-Haida
New Zealanders
2.7%
SINGLE FATHER HOUSEHOLDS
0.0/ 100
METRIC RATING
289th/ 347
METRIC RANK
2.1%
SINGLE FATHER HOUSEHOLDS
99.7/ 100
METRIC RATING
82nd/ 347
METRIC RANK
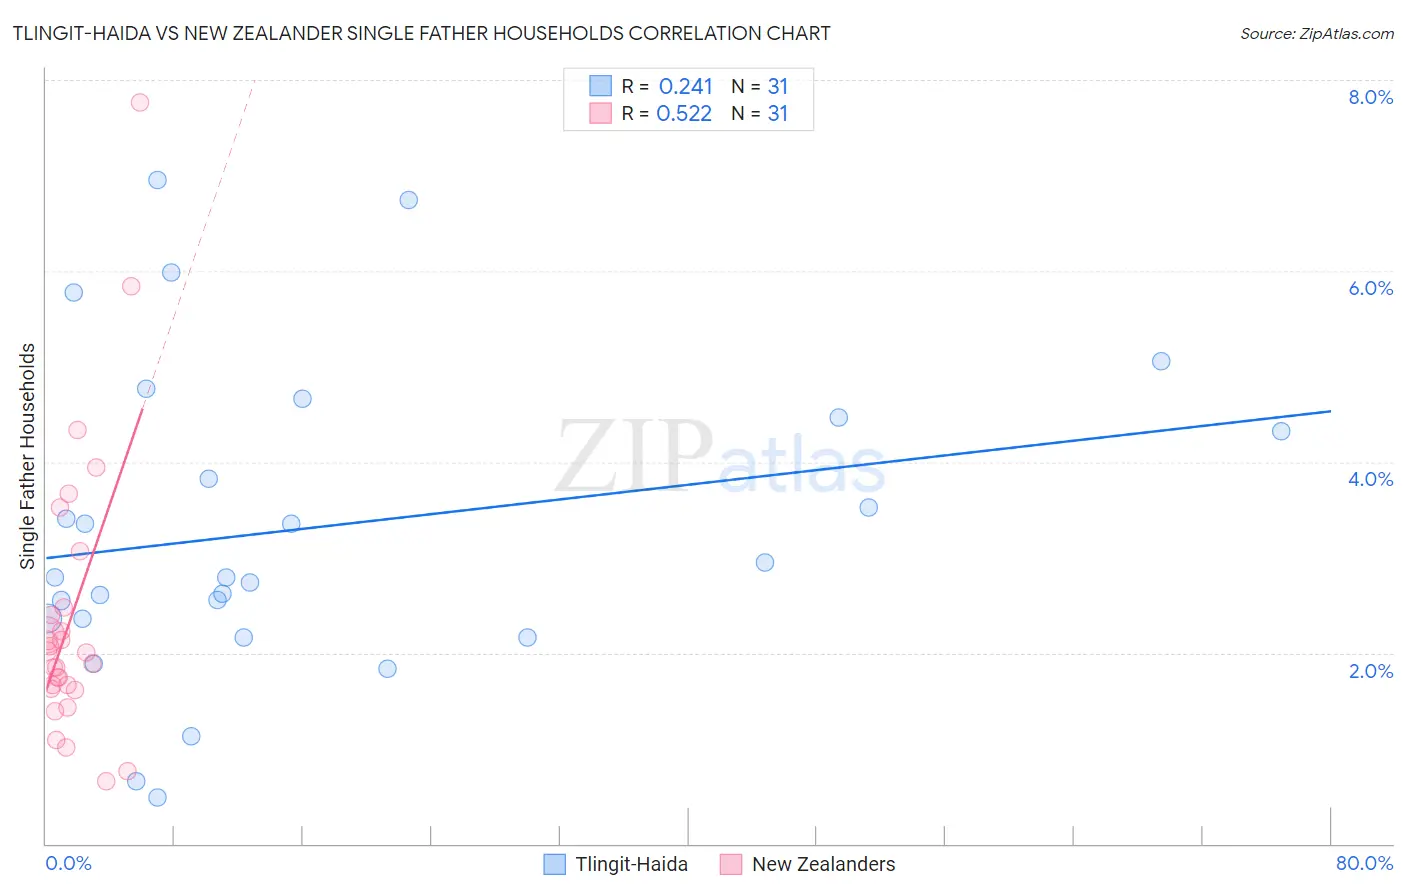
Tlingit-Haida vs New Zealander Single Father Households Correlation Chart
The statistical analysis conducted on geographies consisting of 60,729,668 people shows a weak positive correlation between the proportion of Tlingit-Haida and percentage of single father households in the United States with a correlation coefficient (R) of 0.241 and weighted average of 2.7%. Similarly, the statistical analysis conducted on geographies consisting of 106,675,257 people shows a substantial positive correlation between the proportion of New Zealanders and percentage of single father households in the United States with a correlation coefficient (R) of 0.522 and weighted average of 2.1%, a difference of 27.9%.
Single Father Households Correlation Summary
| Measurement | Tlingit-Haida | New Zealander |
| Minimum | 0.49% | 0.66% |
| Maximum | 6.9% | 7.8% |
| Range | 6.5% | 7.1% |
| Mean | 3.3% | 2.4% |
| Median | 2.8% | 2.0% |
| Interquartile 25% (IQ1) | 2.4% | 1.6% |
| Interquartile 75% (IQ3) | 4.5% | 2.5% |
| Interquartile Range (IQR) | 2.1% | 0.84% |
| Standard Deviation (Sample) | 1.6% | 1.5% |
| Standard Deviation (Population) | 1.6% | 1.5% |
Similar Demographics by Single Father Households
Demographics Similar to Tlingit-Haida by Single Father Households
In terms of single father households, the demographic groups most similar to Tlingit-Haida are Immigrants from Cambodia (2.7%, a difference of 0.060%), Central American Indian (2.7%, a difference of 0.31%), Puget Sound Salish (2.7%, a difference of 0.45%), Ottawa (2.7%, a difference of 0.47%), and Immigrants from Cuba (2.7%, a difference of 0.47%).
| Demographics | Rating | Rank | Single Father Households |
| Dutch West Indians | 0.1 /100 | #282 | Tragic 2.6% |
| Immigrants | Nicaragua | 0.1 /100 | #283 | Tragic 2.7% |
| Hawaiians | 0.1 /100 | #284 | Tragic 2.7% |
| Ottawa | 0.1 /100 | #285 | Tragic 2.7% |
| Immigrants | Cuba | 0.1 /100 | #286 | Tragic 2.7% |
| Central American Indians | 0.0 /100 | #287 | Tragic 2.7% |
| Immigrants | Cambodia | 0.0 /100 | #288 | Tragic 2.7% |
| Tlingit-Haida | 0.0 /100 | #289 | Tragic 2.7% |
| Puget Sound Salish | 0.0 /100 | #290 | Tragic 2.7% |
| Blackfeet | 0.0 /100 | #291 | Tragic 2.7% |
| Choctaw | 0.0 /100 | #292 | Tragic 2.7% |
| Immigrants | Fiji | 0.0 /100 | #293 | Tragic 2.7% |
| Malaysians | 0.0 /100 | #294 | Tragic 2.7% |
| Chickasaw | 0.0 /100 | #295 | Tragic 2.8% |
| Japanese | 0.0 /100 | #296 | Tragic 2.8% |
Demographics Similar to New Zealanders by Single Father Households
In terms of single father households, the demographic groups most similar to New Zealanders are Greek (2.1%, a difference of 0.010%), Armenian (2.1%, a difference of 0.050%), Immigrants from South Africa (2.1%, a difference of 0.13%), Immigrants from Asia (2.1%, a difference of 0.22%), and Carpatho Rusyn (2.1%, a difference of 0.31%).
| Demographics | Rating | Rank | Single Father Households |
| Immigrants | Sweden | 99.8 /100 | #75 | Exceptional 2.1% |
| Immigrants | Scotland | 99.8 /100 | #76 | Exceptional 2.1% |
| Immigrants | Saudi Arabia | 99.8 /100 | #77 | Exceptional 2.1% |
| Estonians | 99.7 /100 | #78 | Exceptional 2.1% |
| Immigrants | Asia | 99.7 /100 | #79 | Exceptional 2.1% |
| Immigrants | South Africa | 99.7 /100 | #80 | Exceptional 2.1% |
| Armenians | 99.7 /100 | #81 | Exceptional 2.1% |
| New Zealanders | 99.7 /100 | #82 | Exceptional 2.1% |
| Greeks | 99.7 /100 | #83 | Exceptional 2.1% |
| Carpatho Rusyns | 99.6 /100 | #84 | Exceptional 2.1% |
| Immigrants | Hungary | 99.6 /100 | #85 | Exceptional 2.1% |
| Asians | 99.6 /100 | #86 | Exceptional 2.1% |
| Lithuanians | 99.5 /100 | #87 | Exceptional 2.1% |
| Bhutanese | 99.5 /100 | #88 | Exceptional 2.1% |
| Immigrants | Armenia | 99.5 /100 | #89 | Exceptional 2.1% |