Tlingit-Haida vs Immigrants from Ghana Single Father Households
COMPARE
Tlingit-Haida
Immigrants from Ghana
Single Father Households
Single Father Households Comparison
Tlingit-Haida
Immigrants from Ghana
2.7%
SINGLE FATHER HOUSEHOLDS
0.0/ 100
METRIC RATING
289th/ 347
METRIC RANK
2.4%
SINGLE FATHER HOUSEHOLDS
9.1/ 100
METRIC RATING
228th/ 347
METRIC RANK
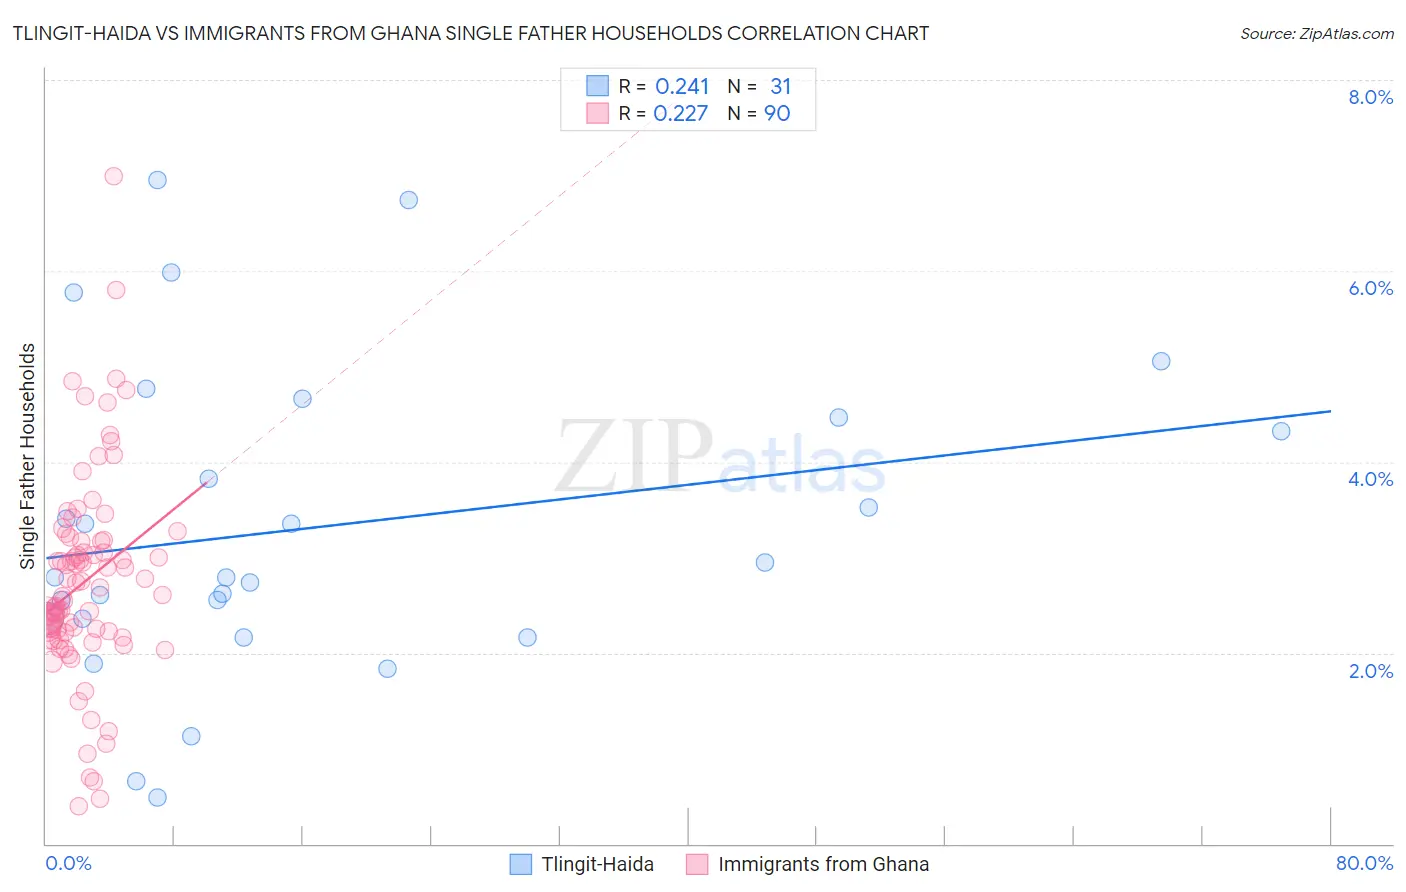
Tlingit-Haida vs Immigrants from Ghana Single Father Households Correlation Chart
The statistical analysis conducted on geographies consisting of 60,729,668 people shows a weak positive correlation between the proportion of Tlingit-Haida and percentage of single father households in the United States with a correlation coefficient (R) of 0.241 and weighted average of 2.7%. Similarly, the statistical analysis conducted on geographies consisting of 199,188,278 people shows a weak positive correlation between the proportion of Immigrants from Ghana and percentage of single father households in the United States with a correlation coefficient (R) of 0.227 and weighted average of 2.4%, a difference of 9.8%.
Single Father Households Correlation Summary
| Measurement | Tlingit-Haida | Immigrants from Ghana |
| Minimum | 0.49% | 0.39% |
| Maximum | 6.9% | 7.0% |
| Range | 6.5% | 6.6% |
| Mean | 3.3% | 2.8% |
| Median | 2.8% | 2.6% |
| Interquartile 25% (IQ1) | 2.4% | 2.2% |
| Interquartile 75% (IQ3) | 4.5% | 3.2% |
| Interquartile Range (IQR) | 2.1% | 0.96% |
| Standard Deviation (Sample) | 1.6% | 1.1% |
| Standard Deviation (Population) | 1.6% | 1.1% |
Similar Demographics by Single Father Households
Demographics Similar to Tlingit-Haida by Single Father Households
In terms of single father households, the demographic groups most similar to Tlingit-Haida are Immigrants from Cambodia (2.7%, a difference of 0.060%), Central American Indian (2.7%, a difference of 0.31%), Puget Sound Salish (2.7%, a difference of 0.45%), Ottawa (2.7%, a difference of 0.47%), and Immigrants from Cuba (2.7%, a difference of 0.47%).
| Demographics | Rating | Rank | Single Father Households |
| Dutch West Indians | 0.1 /100 | #282 | Tragic 2.6% |
| Immigrants | Nicaragua | 0.1 /100 | #283 | Tragic 2.7% |
| Hawaiians | 0.1 /100 | #284 | Tragic 2.7% |
| Ottawa | 0.1 /100 | #285 | Tragic 2.7% |
| Immigrants | Cuba | 0.1 /100 | #286 | Tragic 2.7% |
| Central American Indians | 0.0 /100 | #287 | Tragic 2.7% |
| Immigrants | Cambodia | 0.0 /100 | #288 | Tragic 2.7% |
| Tlingit-Haida | 0.0 /100 | #289 | Tragic 2.7% |
| Puget Sound Salish | 0.0 /100 | #290 | Tragic 2.7% |
| Blackfeet | 0.0 /100 | #291 | Tragic 2.7% |
| Choctaw | 0.0 /100 | #292 | Tragic 2.7% |
| Immigrants | Fiji | 0.0 /100 | #293 | Tragic 2.7% |
| Malaysians | 0.0 /100 | #294 | Tragic 2.7% |
| Chickasaw | 0.0 /100 | #295 | Tragic 2.8% |
| Japanese | 0.0 /100 | #296 | Tragic 2.8% |
Demographics Similar to Immigrants from Ghana by Single Father Households
In terms of single father households, the demographic groups most similar to Immigrants from Ghana are American (2.4%, a difference of 0.040%), Black/African American (2.4%, a difference of 0.11%), Immigrants from Zaire (2.4%, a difference of 0.11%), Marshallese (2.4%, a difference of 0.12%), and Subsaharan African (2.4%, a difference of 0.20%).
| Demographics | Rating | Rank | Single Father Households |
| Immigrants | Burma/Myanmar | 12.1 /100 | #221 | Poor 2.4% |
| Immigrants | Eastern Africa | 11.9 /100 | #222 | Poor 2.4% |
| Immigrants | Uruguay | 11.0 /100 | #223 | Poor 2.4% |
| Immigrants | Bahamas | 10.6 /100 | #224 | Poor 2.4% |
| Marshallese | 9.7 /100 | #225 | Tragic 2.4% |
| Blacks/African Americans | 9.7 /100 | #226 | Tragic 2.4% |
| Americans | 9.3 /100 | #227 | Tragic 2.4% |
| Immigrants | Ghana | 9.1 /100 | #228 | Tragic 2.4% |
| Immigrants | Zaire | 8.6 /100 | #229 | Tragic 2.4% |
| Sub-Saharan Africans | 8.3 /100 | #230 | Tragic 2.4% |
| Immigrants | Nonimmigrants | 7.6 /100 | #231 | Tragic 2.4% |
| Pennsylvania Germans | 7.3 /100 | #232 | Tragic 2.4% |
| Immigrants | Western Africa | 7.0 /100 | #233 | Tragic 2.4% |
| Africans | 6.3 /100 | #234 | Tragic 2.5% |
| Immigrants | Immigrants | 6.3 /100 | #235 | Tragic 2.5% |