Syrian vs U.S. Virgin Islander Householder Income Ages 45 - 64 years
COMPARE
Syrian
U.S. Virgin Islander
Householder Income Ages 45 - 64 years
Householder Income Ages 45 - 64 years Comparison
Syrians
U.S. Virgin Islanders
$107,207
HOUSEHOLDER INCOME AGES 45 - 64 YEARS
96.9/ 100
METRIC RATING
103rd/ 347
METRIC RANK
$82,736
HOUSEHOLDER INCOME AGES 45 - 64 YEARS
0.0/ 100
METRIC RATING
313th/ 347
METRIC RANK
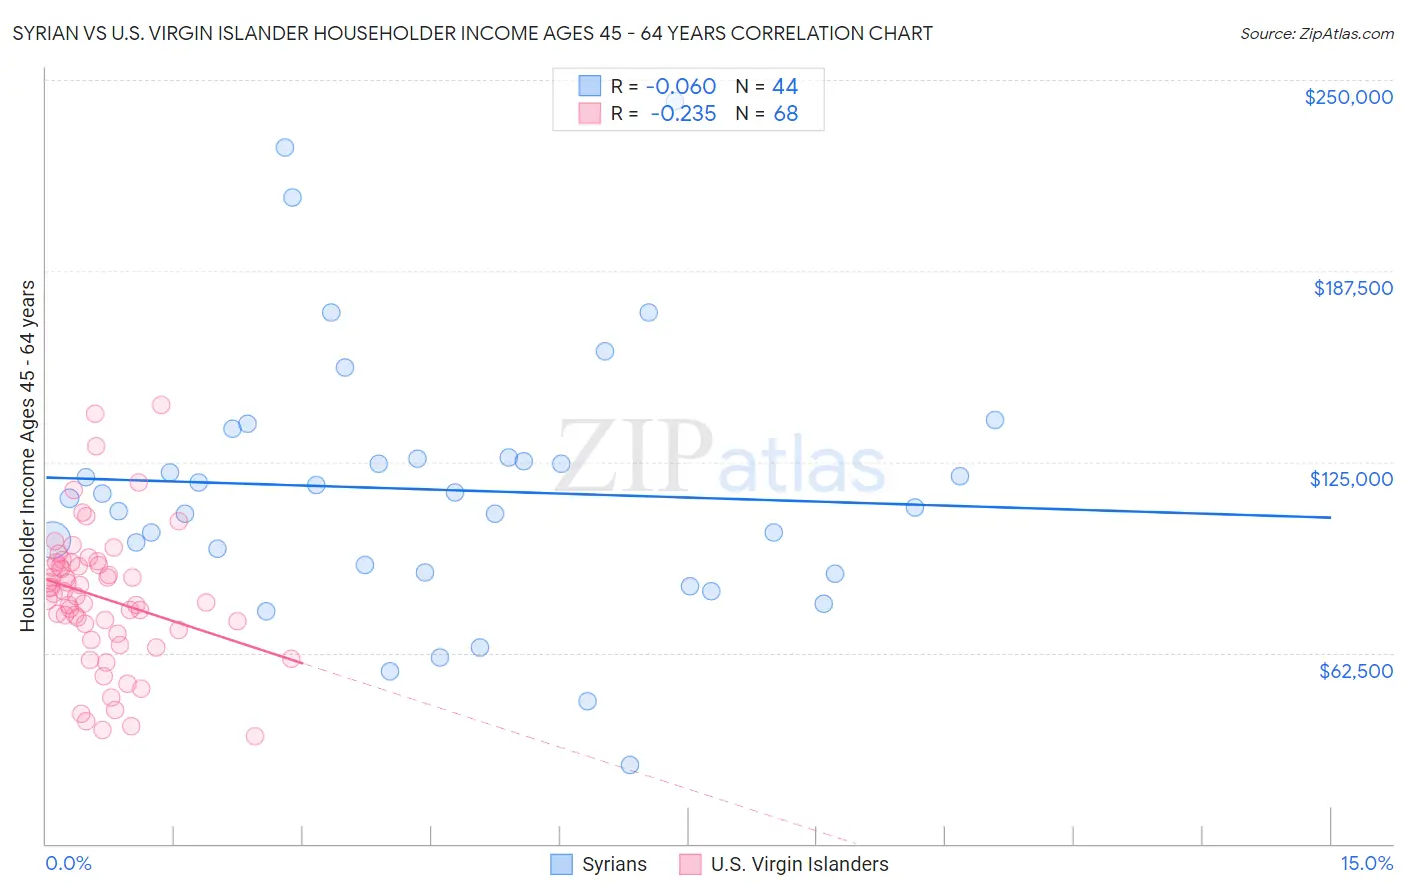
Syrian vs U.S. Virgin Islander Householder Income Ages 45 - 64 years Correlation Chart
The statistical analysis conducted on geographies consisting of 266,033,400 people shows a slight negative correlation between the proportion of Syrians and household income with householder between the ages 45 and 64 in the United States with a correlation coefficient (R) of -0.060 and weighted average of $107,207. Similarly, the statistical analysis conducted on geographies consisting of 87,479,620 people shows a weak negative correlation between the proportion of U.S. Virgin Islanders and household income with householder between the ages 45 and 64 in the United States with a correlation coefficient (R) of -0.235 and weighted average of $82,736, a difference of 29.6%.
Householder Income Ages 45 - 64 years Correlation Summary
| Measurement | Syrian | U.S. Virgin Islander |
| Minimum | $25,909 | $35,018 |
| Maximum | $243,024 | $143,798 |
| Range | $217,115 | $108,780 |
| Mean | $115,941 | $80,559 |
| Median | $113,826 | $81,314 |
| Interquartile 25% (IQ1) | $89,983 | $69,189 |
| Interquartile 75% (IQ3) | $126,144 | $91,656 |
| Interquartile Range (IQR) | $36,161 | $22,467 |
| Standard Deviation (Sample) | $43,404 | $22,451 |
| Standard Deviation (Population) | $42,908 | $22,285 |
Similar Demographics by Householder Income Ages 45 - 64 years
Demographics Similar to Syrians by Householder Income Ages 45 - 64 years
In terms of householder income ages 45 - 64 years, the demographic groups most similar to Syrians are Immigrants from Ukraine ($107,079, a difference of 0.12%), Macedonian ($107,074, a difference of 0.12%), Immigrants from Moldova ($107,357, a difference of 0.14%), Immigrants from Kazakhstan ($107,378, a difference of 0.16%), and Armenian ($107,002, a difference of 0.19%).
| Demographics | Rating | Rank | Householder Income Ages 45 - 64 years |
| Immigrants | Argentina | 98.2 /100 | #96 | Exceptional $108,264 |
| Northern Europeans | 97.8 /100 | #97 | Exceptional $107,870 |
| Immigrants | Southern Europe | 97.7 /100 | #98 | Exceptional $107,775 |
| Palestinians | 97.6 /100 | #99 | Exceptional $107,721 |
| Immigrants | Serbia | 97.4 /100 | #100 | Exceptional $107,569 |
| Immigrants | Kazakhstan | 97.2 /100 | #101 | Exceptional $107,378 |
| Immigrants | Moldova | 97.1 /100 | #102 | Exceptional $107,357 |
| Syrians | 96.9 /100 | #103 | Exceptional $107,207 |
| Immigrants | Ukraine | 96.7 /100 | #104 | Exceptional $107,079 |
| Macedonians | 96.7 /100 | #105 | Exceptional $107,074 |
| Armenians | 96.6 /100 | #106 | Exceptional $107,002 |
| Immigrants | Fiji | 96.5 /100 | #107 | Exceptional $106,952 |
| Zimbabweans | 96.3 /100 | #108 | Exceptional $106,849 |
| Chileans | 95.9 /100 | #109 | Exceptional $106,611 |
| Immigrants | Brazil | 95.6 /100 | #110 | Exceptional $106,470 |
Demographics Similar to U.S. Virgin Islanders by Householder Income Ages 45 - 64 years
In terms of householder income ages 45 - 64 years, the demographic groups most similar to U.S. Virgin Islanders are Immigrants from Honduras ($82,697, a difference of 0.050%), Paiute ($82,629, a difference of 0.13%), Immigrants from Caribbean ($82,513, a difference of 0.27%), Colville ($82,474, a difference of 0.32%), and Cajun ($83,015, a difference of 0.34%).
| Demographics | Rating | Rank | Householder Income Ages 45 - 64 years |
| Ute | 0.0 /100 | #306 | Tragic $83,937 |
| Shoshone | 0.0 /100 | #307 | Tragic $83,588 |
| Immigrants | Cabo Verde | 0.0 /100 | #308 | Tragic $83,542 |
| Immigrants | Dominica | 0.0 /100 | #309 | Tragic $83,311 |
| Immigrants | Haiti | 0.0 /100 | #310 | Tragic $83,257 |
| Immigrants | Bahamas | 0.0 /100 | #311 | Tragic $83,177 |
| Cajuns | 0.0 /100 | #312 | Tragic $83,015 |
| U.S. Virgin Islanders | 0.0 /100 | #313 | Tragic $82,736 |
| Immigrants | Honduras | 0.0 /100 | #314 | Tragic $82,697 |
| Paiute | 0.0 /100 | #315 | Tragic $82,629 |
| Immigrants | Caribbean | 0.0 /100 | #316 | Tragic $82,513 |
| Colville | 0.0 /100 | #317 | Tragic $82,474 |
| Choctaw | 0.0 /100 | #318 | Tragic $82,287 |
| Chickasaw | 0.0 /100 | #319 | Tragic $82,193 |
| Apache | 0.0 /100 | #320 | Tragic $82,184 |