Syrian vs Immigrants from Guatemala Average Family Size
COMPARE
Syrian
Immigrants from Guatemala
Average Family Size
Average Family Size Comparison
Syrians
Immigrants from Guatemala
3.19
AVERAGE FAMILY SIZE
6.5/ 100
METRIC RATING
224th/ 347
METRIC RANK
3.41
AVERAGE FAMILY SIZE
100.0/ 100
METRIC RATING
32nd/ 347
METRIC RANK
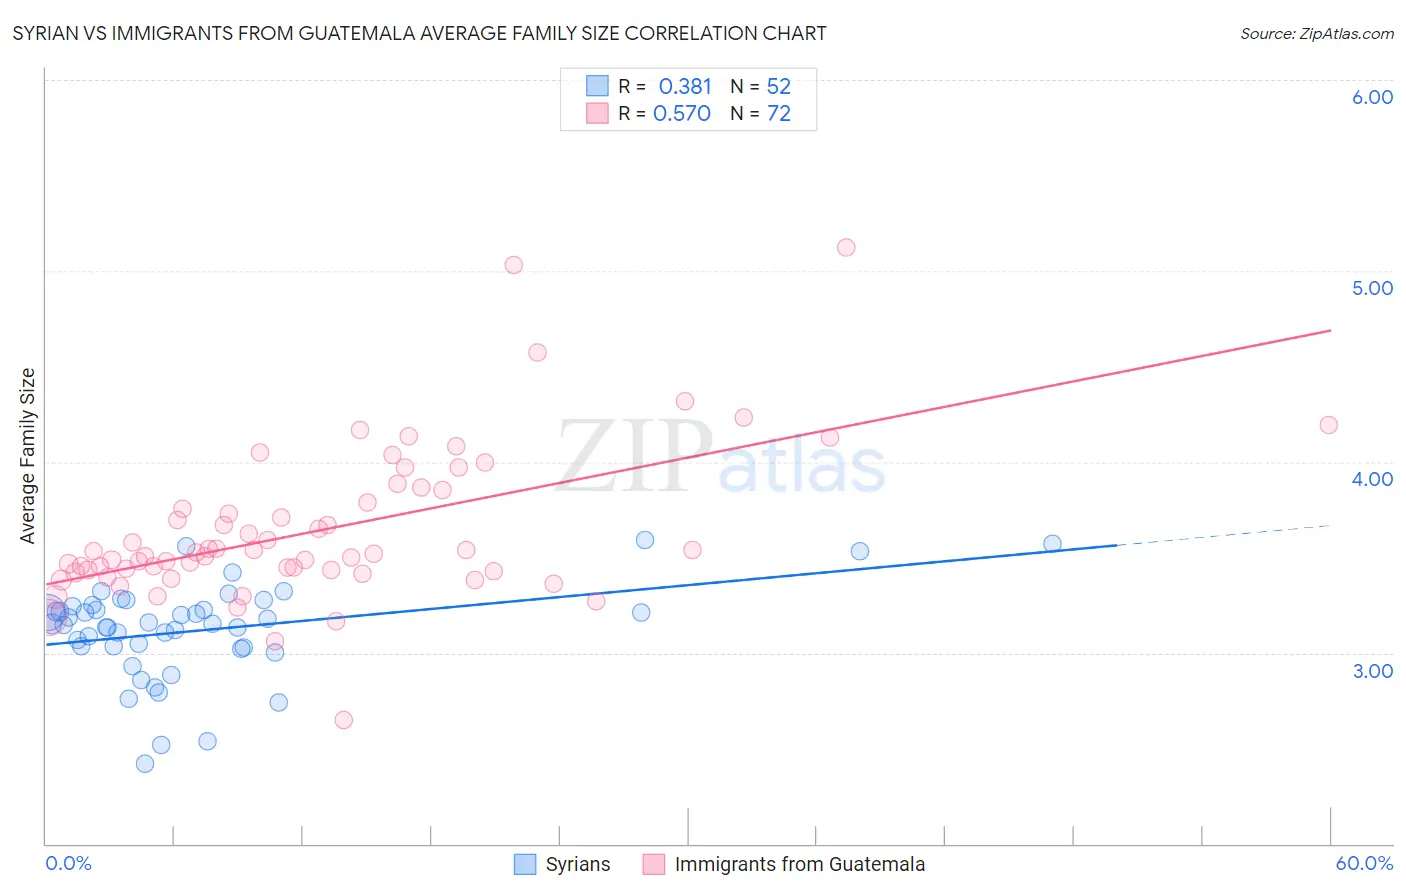
Syrian vs Immigrants from Guatemala Average Family Size Correlation Chart
The statistical analysis conducted on geographies consisting of 266,181,875 people shows a mild positive correlation between the proportion of Syrians and average family size in the United States with a correlation coefficient (R) of 0.381 and weighted average of 3.19. Similarly, the statistical analysis conducted on geographies consisting of 377,174,912 people shows a substantial positive correlation between the proportion of Immigrants from Guatemala and average family size in the United States with a correlation coefficient (R) of 0.570 and weighted average of 3.41, a difference of 6.9%.
Average Family Size Correlation Summary
| Measurement | Syrian | Immigrants from Guatemala |
| Minimum | 2.42 | 2.65 |
| Maximum | 3.59 | 5.12 |
| Range | 1.17 | 2.47 |
| Mean | 3.12 | 3.64 |
| Median | 3.15 | 3.52 |
| Interquartile 25% (IQ1) | 3.03 | 3.43 |
| Interquartile 75% (IQ3) | 3.23 | 3.82 |
| Interquartile Range (IQR) | 0.20 | 0.39 |
| Standard Deviation (Sample) | 0.25 | 0.40 |
| Standard Deviation (Population) | 0.24 | 0.40 |
Similar Demographics by Average Family Size
Demographics Similar to Syrians by Average Family Size
In terms of average family size, the demographic groups most similar to Syrians are Cree (3.19, a difference of 0.020%), Immigrants from Zimbabwe (3.19, a difference of 0.040%), Chickasaw (3.19, a difference of 0.040%), Portuguese (3.19, a difference of 0.040%), and Immigrants from Ukraine (3.19, a difference of 0.050%).
| Demographics | Rating | Rank | Average Family Size |
| Immigrants | Somalia | 10.3 /100 | #217 | Poor 3.20 |
| French American Indians | 9.8 /100 | #218 | Tragic 3.20 |
| Pennsylvania Germans | 9.3 /100 | #219 | Tragic 3.19 |
| Lebanese | 9.1 /100 | #220 | Tragic 3.19 |
| Immigrants | Ukraine | 7.2 /100 | #221 | Tragic 3.19 |
| Immigrants | Kuwait | 7.2 /100 | #222 | Tragic 3.19 |
| Immigrants | Zimbabwe | 7.1 /100 | #223 | Tragic 3.19 |
| Syrians | 6.5 /100 | #224 | Tragic 3.19 |
| Cree | 6.2 /100 | #225 | Tragic 3.19 |
| Chickasaw | 6.0 /100 | #226 | Tragic 3.19 |
| Portuguese | 6.0 /100 | #227 | Tragic 3.19 |
| Immigrants | Nonimmigrants | 5.7 /100 | #228 | Tragic 3.19 |
| Immigrants | Italy | 5.3 /100 | #229 | Tragic 3.19 |
| Icelanders | 5.2 /100 | #230 | Tragic 3.19 |
| Basques | 5.2 /100 | #231 | Tragic 3.19 |
Demographics Similar to Immigrants from Guatemala by Average Family Size
In terms of average family size, the demographic groups most similar to Immigrants from Guatemala are Hawaiian (3.41, a difference of 0.030%), Hispanic or Latino (3.41, a difference of 0.080%), Central American (3.41, a difference of 0.10%), Guatemalan (3.40, a difference of 0.14%), and Immigrants from Guyana (3.40, a difference of 0.19%).
| Demographics | Rating | Rank | Average Family Size |
| Yakama | 100.0 /100 | #25 | Exceptional 3.45 |
| Native Hawaiians | 100.0 /100 | #26 | Exceptional 3.43 |
| Mexican American Indians | 100.0 /100 | #27 | Exceptional 3.43 |
| Immigrants | Latin America | 100.0 /100 | #28 | Exceptional 3.42 |
| Nepalese | 100.0 /100 | #29 | Exceptional 3.42 |
| Samoans | 100.0 /100 | #30 | Exceptional 3.42 |
| Central Americans | 100.0 /100 | #31 | Exceptional 3.41 |
| Immigrants | Guatemala | 100.0 /100 | #32 | Exceptional 3.41 |
| Hawaiians | 100.0 /100 | #33 | Exceptional 3.41 |
| Hispanics or Latinos | 100.0 /100 | #34 | Exceptional 3.41 |
| Guatemalans | 100.0 /100 | #35 | Exceptional 3.40 |
| Immigrants | Guyana | 100.0 /100 | #36 | Exceptional 3.40 |
| Guyanese | 100.0 /100 | #37 | Exceptional 3.40 |
| Immigrants | Belize | 100.0 /100 | #38 | Exceptional 3.39 |
| Immigrants | Haiti | 100.0 /100 | #39 | Exceptional 3.39 |