Syrian vs Immigrants from Ecuador Average Family Size
COMPARE
Syrian
Immigrants from Ecuador
Average Family Size
Average Family Size Comparison
Syrians
Immigrants from Ecuador
3.19
AVERAGE FAMILY SIZE
6.5/ 100
METRIC RATING
224th/ 347
METRIC RANK
3.32
AVERAGE FAMILY SIZE
99.8/ 100
METRIC RATING
77th/ 347
METRIC RANK
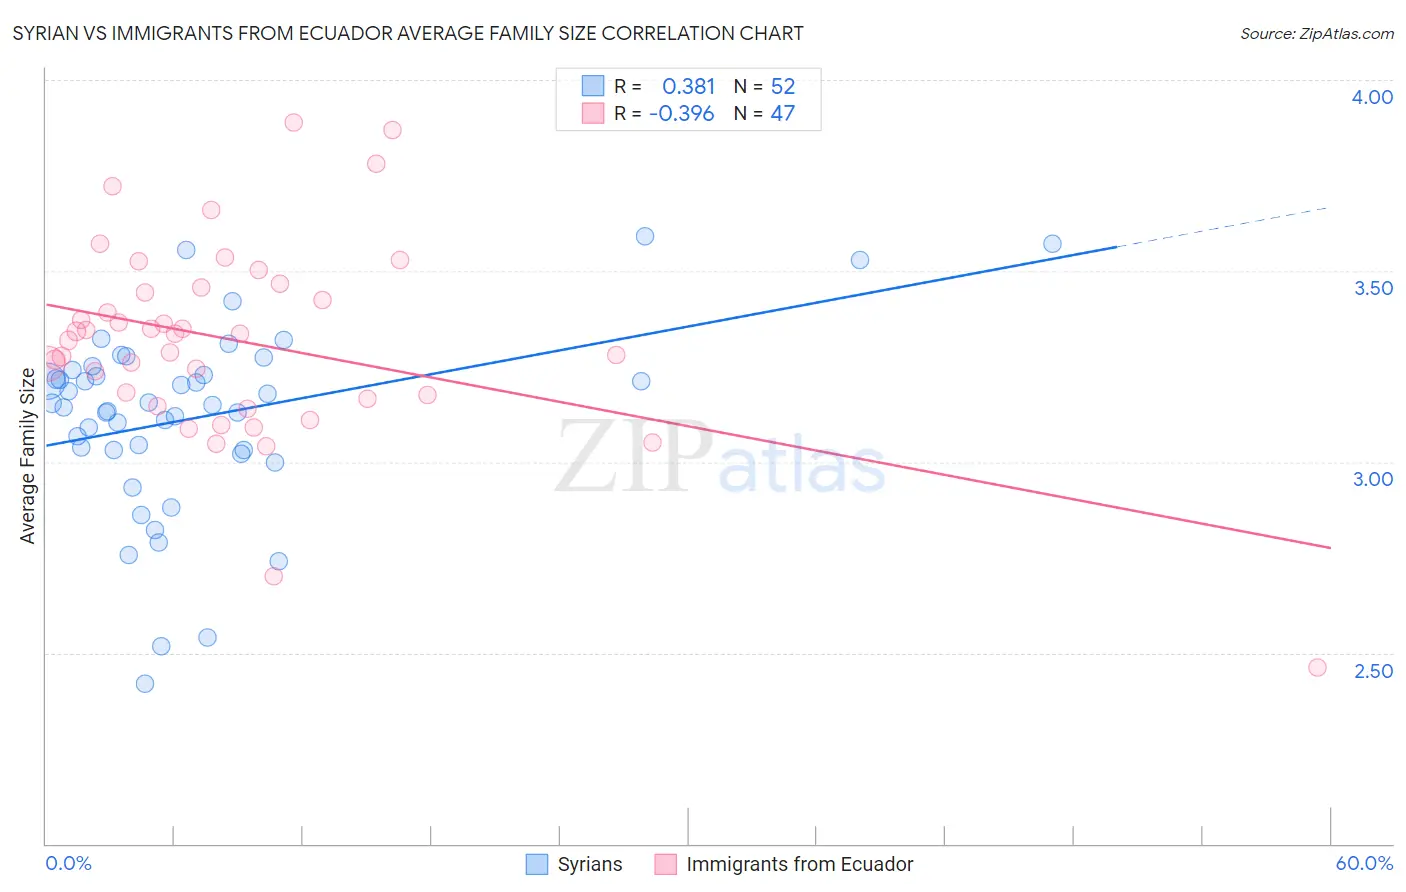
Syrian vs Immigrants from Ecuador Average Family Size Correlation Chart
The statistical analysis conducted on geographies consisting of 266,181,875 people shows a mild positive correlation between the proportion of Syrians and average family size in the United States with a correlation coefficient (R) of 0.381 and weighted average of 3.19. Similarly, the statistical analysis conducted on geographies consisting of 270,888,675 people shows a mild negative correlation between the proportion of Immigrants from Ecuador and average family size in the United States with a correlation coefficient (R) of -0.396 and weighted average of 3.32, a difference of 4.2%.
Average Family Size Correlation Summary
| Measurement | Syrian | Immigrants from Ecuador |
| Minimum | 2.42 | 2.46 |
| Maximum | 3.59 | 3.89 |
| Range | 1.17 | 1.43 |
| Mean | 3.12 | 3.32 |
| Median | 3.15 | 3.34 |
| Interquartile 25% (IQ1) | 3.03 | 3.17 |
| Interquartile 75% (IQ3) | 3.23 | 3.46 |
| Interquartile Range (IQR) | 0.20 | 0.29 |
| Standard Deviation (Sample) | 0.25 | 0.26 |
| Standard Deviation (Population) | 0.24 | 0.26 |
Similar Demographics by Average Family Size
Demographics Similar to Syrians by Average Family Size
In terms of average family size, the demographic groups most similar to Syrians are Cree (3.19, a difference of 0.020%), Immigrants from Zimbabwe (3.19, a difference of 0.040%), Chickasaw (3.19, a difference of 0.040%), Portuguese (3.19, a difference of 0.040%), and Immigrants from Ukraine (3.19, a difference of 0.050%).
| Demographics | Rating | Rank | Average Family Size |
| Immigrants | Somalia | 10.3 /100 | #217 | Poor 3.20 |
| French American Indians | 9.8 /100 | #218 | Tragic 3.20 |
| Pennsylvania Germans | 9.3 /100 | #219 | Tragic 3.19 |
| Lebanese | 9.1 /100 | #220 | Tragic 3.19 |
| Immigrants | Ukraine | 7.2 /100 | #221 | Tragic 3.19 |
| Immigrants | Kuwait | 7.2 /100 | #222 | Tragic 3.19 |
| Immigrants | Zimbabwe | 7.1 /100 | #223 | Tragic 3.19 |
| Syrians | 6.5 /100 | #224 | Tragic 3.19 |
| Cree | 6.2 /100 | #225 | Tragic 3.19 |
| Chickasaw | 6.0 /100 | #226 | Tragic 3.19 |
| Portuguese | 6.0 /100 | #227 | Tragic 3.19 |
| Immigrants | Nonimmigrants | 5.7 /100 | #228 | Tragic 3.19 |
| Immigrants | Italy | 5.3 /100 | #229 | Tragic 3.19 |
| Icelanders | 5.2 /100 | #230 | Tragic 3.19 |
| Basques | 5.2 /100 | #231 | Tragic 3.19 |
Demographics Similar to Immigrants from Ecuador by Average Family Size
In terms of average family size, the demographic groups most similar to Immigrants from Ecuador are Trinidadian and Tobagonian (3.32, a difference of 0.010%), Immigrants from Barbados (3.32, a difference of 0.030%), Immigrants from Micronesia (3.32, a difference of 0.040%), British West Indian (3.32, a difference of 0.050%), and Immigrants from Sierra Leone (3.32, a difference of 0.060%).
| Demographics | Rating | Rank | Average Family Size |
| Immigrants | Trinidad and Tobago | 99.9 /100 | #70 | Exceptional 3.33 |
| Immigrants | West Indies | 99.9 /100 | #71 | Exceptional 3.33 |
| Immigrants | Caribbean | 99.9 /100 | #72 | Exceptional 3.33 |
| Yaqui | 99.9 /100 | #73 | Exceptional 3.32 |
| Immigrants | Sierra Leone | 99.9 /100 | #74 | Exceptional 3.32 |
| Immigrants | Barbados | 99.8 /100 | #75 | Exceptional 3.32 |
| Trinidadians and Tobagonians | 99.8 /100 | #76 | Exceptional 3.32 |
| Immigrants | Ecuador | 99.8 /100 | #77 | Exceptional 3.32 |
| Immigrants | Micronesia | 99.8 /100 | #78 | Exceptional 3.32 |
| British West Indians | 99.8 /100 | #79 | Exceptional 3.32 |
| Lumbee | 99.8 /100 | #80 | Exceptional 3.32 |
| Immigrants | Dominica | 99.8 /100 | #81 | Exceptional 3.32 |
| Ecuadorians | 99.8 /100 | #82 | Exceptional 3.32 |
| Immigrants | Afghanistan | 99.8 /100 | #83 | Exceptional 3.32 |
| Immigrants | Nigeria | 99.7 /100 | #84 | Exceptional 3.32 |