Syrian vs Northern European Average Family Size
COMPARE
Syrian
Northern European
Average Family Size
Average Family Size Comparison
Syrians
Northern Europeans
3.19
AVERAGE FAMILY SIZE
6.5/ 100
METRIC RATING
224th/ 347
METRIC RANK
3.13
AVERAGE FAMILY SIZE
0.1/ 100
METRIC RATING
309th/ 347
METRIC RANK
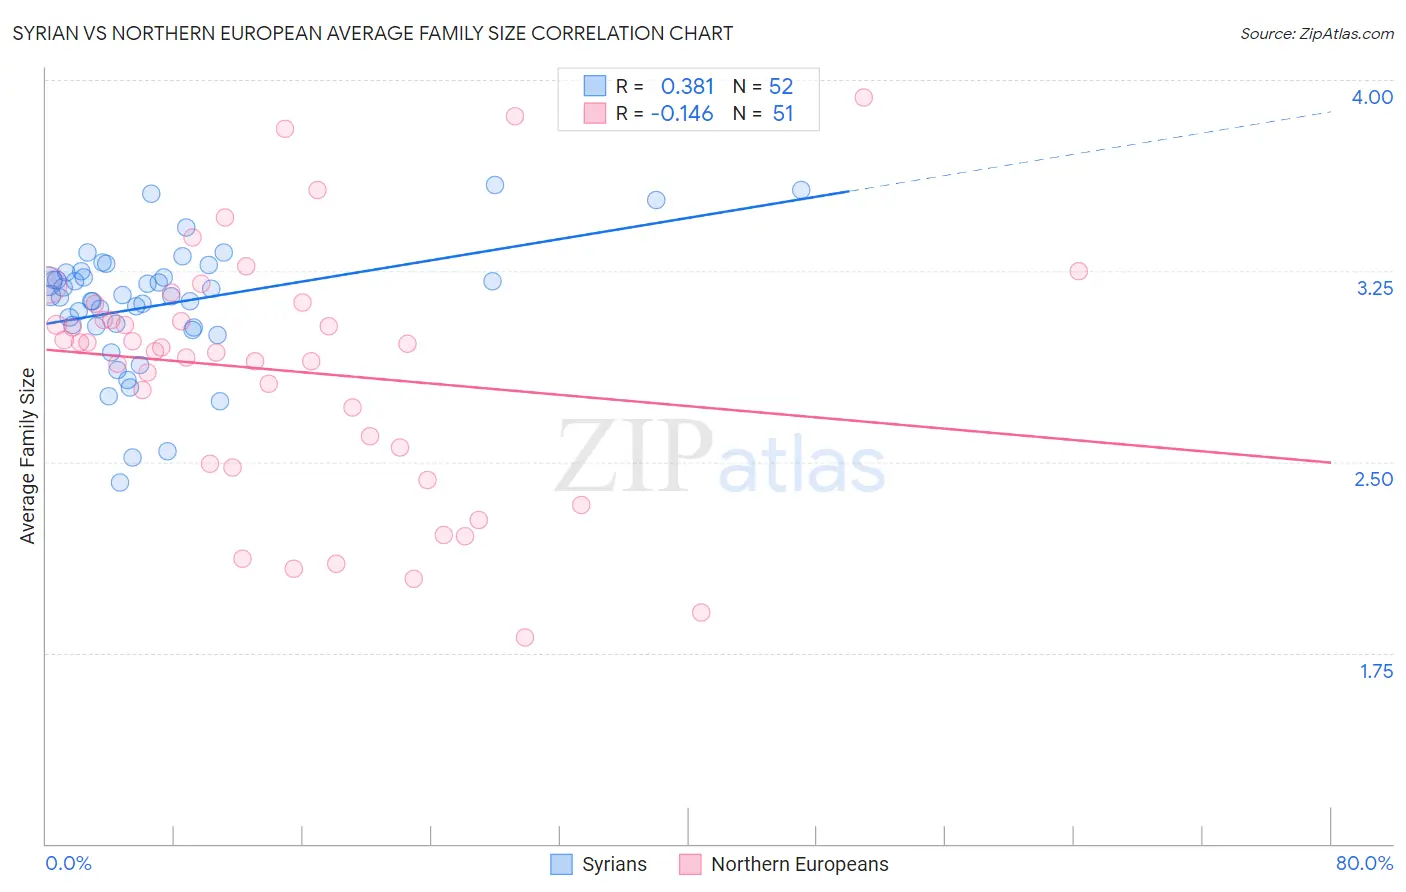
Syrian vs Northern European Average Family Size Correlation Chart
The statistical analysis conducted on geographies consisting of 266,181,875 people shows a mild positive correlation between the proportion of Syrians and average family size in the United States with a correlation coefficient (R) of 0.381 and weighted average of 3.19. Similarly, the statistical analysis conducted on geographies consisting of 405,947,196 people shows a poor negative correlation between the proportion of Northern Europeans and average family size in the United States with a correlation coefficient (R) of -0.146 and weighted average of 3.13, a difference of 1.9%.
Average Family Size Correlation Summary
| Measurement | Syrian | Northern European |
| Minimum | 2.42 | 1.81 |
| Maximum | 3.59 | 3.93 |
| Range | 1.17 | 2.12 |
| Mean | 3.12 | 2.86 |
| Median | 3.15 | 2.95 |
| Interquartile 25% (IQ1) | 3.03 | 2.49 |
| Interquartile 75% (IQ3) | 3.23 | 3.12 |
| Interquartile Range (IQR) | 0.20 | 0.63 |
| Standard Deviation (Sample) | 0.25 | 0.49 |
| Standard Deviation (Population) | 0.24 | 0.48 |
Similar Demographics by Average Family Size
Demographics Similar to Syrians by Average Family Size
In terms of average family size, the demographic groups most similar to Syrians are Cree (3.19, a difference of 0.020%), Immigrants from Zimbabwe (3.19, a difference of 0.040%), Chickasaw (3.19, a difference of 0.040%), Portuguese (3.19, a difference of 0.040%), and Immigrants from Ukraine (3.19, a difference of 0.050%).
| Demographics | Rating | Rank | Average Family Size |
| Immigrants | Somalia | 10.3 /100 | #217 | Poor 3.20 |
| French American Indians | 9.8 /100 | #218 | Tragic 3.20 |
| Pennsylvania Germans | 9.3 /100 | #219 | Tragic 3.19 |
| Lebanese | 9.1 /100 | #220 | Tragic 3.19 |
| Immigrants | Ukraine | 7.2 /100 | #221 | Tragic 3.19 |
| Immigrants | Kuwait | 7.2 /100 | #222 | Tragic 3.19 |
| Immigrants | Zimbabwe | 7.1 /100 | #223 | Tragic 3.19 |
| Syrians | 6.5 /100 | #224 | Tragic 3.19 |
| Cree | 6.2 /100 | #225 | Tragic 3.19 |
| Chickasaw | 6.0 /100 | #226 | Tragic 3.19 |
| Portuguese | 6.0 /100 | #227 | Tragic 3.19 |
| Immigrants | Nonimmigrants | 5.7 /100 | #228 | Tragic 3.19 |
| Immigrants | Italy | 5.3 /100 | #229 | Tragic 3.19 |
| Icelanders | 5.2 /100 | #230 | Tragic 3.19 |
| Basques | 5.2 /100 | #231 | Tragic 3.19 |
Demographics Similar to Northern Europeans by Average Family Size
In terms of average family size, the demographic groups most similar to Northern Europeans are Slavic (3.13, a difference of 0.010%), Czechoslovakian (3.13, a difference of 0.020%), Immigrants from Ireland (3.13, a difference of 0.060%), Immigrants from Serbia (3.13, a difference of 0.060%), and Immigrants from Northern Europe (3.13, a difference of 0.060%).
| Demographics | Rating | Rank | Average Family Size |
| Immigrants | Latvia | 0.2 /100 | #302 | Tragic 3.13 |
| British | 0.2 /100 | #303 | Tragic 3.13 |
| Immigrants | Switzerland | 0.2 /100 | #304 | Tragic 3.13 |
| Australians | 0.1 /100 | #305 | Tragic 3.13 |
| Immigrants | Ireland | 0.1 /100 | #306 | Tragic 3.13 |
| Immigrants | Serbia | 0.1 /100 | #307 | Tragic 3.13 |
| Slavs | 0.1 /100 | #308 | Tragic 3.13 |
| Northern Europeans | 0.1 /100 | #309 | Tragic 3.13 |
| Czechoslovakians | 0.1 /100 | #310 | Tragic 3.13 |
| Immigrants | Northern Europe | 0.1 /100 | #311 | Tragic 3.13 |
| Immigrants | Australia | 0.1 /100 | #312 | Tragic 3.13 |
| Bulgarians | 0.1 /100 | #313 | Tragic 3.13 |
| Russians | 0.1 /100 | #314 | Tragic 3.12 |
| Immigrants | Scotland | 0.1 /100 | #315 | Tragic 3.12 |
| Serbians | 0.1 /100 | #316 | Tragic 3.12 |