Cape Verdean vs Immigrants from Belgium Average Family Size
COMPARE
Cape Verdean
Immigrants from Belgium
Average Family Size
Average Family Size Comparison
Cape Verdeans
Immigrants from Belgium
3.17
AVERAGE FAMILY SIZE
1.6/ 100
METRIC RATING
255th/ 347
METRIC RANK
3.15
AVERAGE FAMILY SIZE
0.6/ 100
METRIC RATING
274th/ 347
METRIC RANK
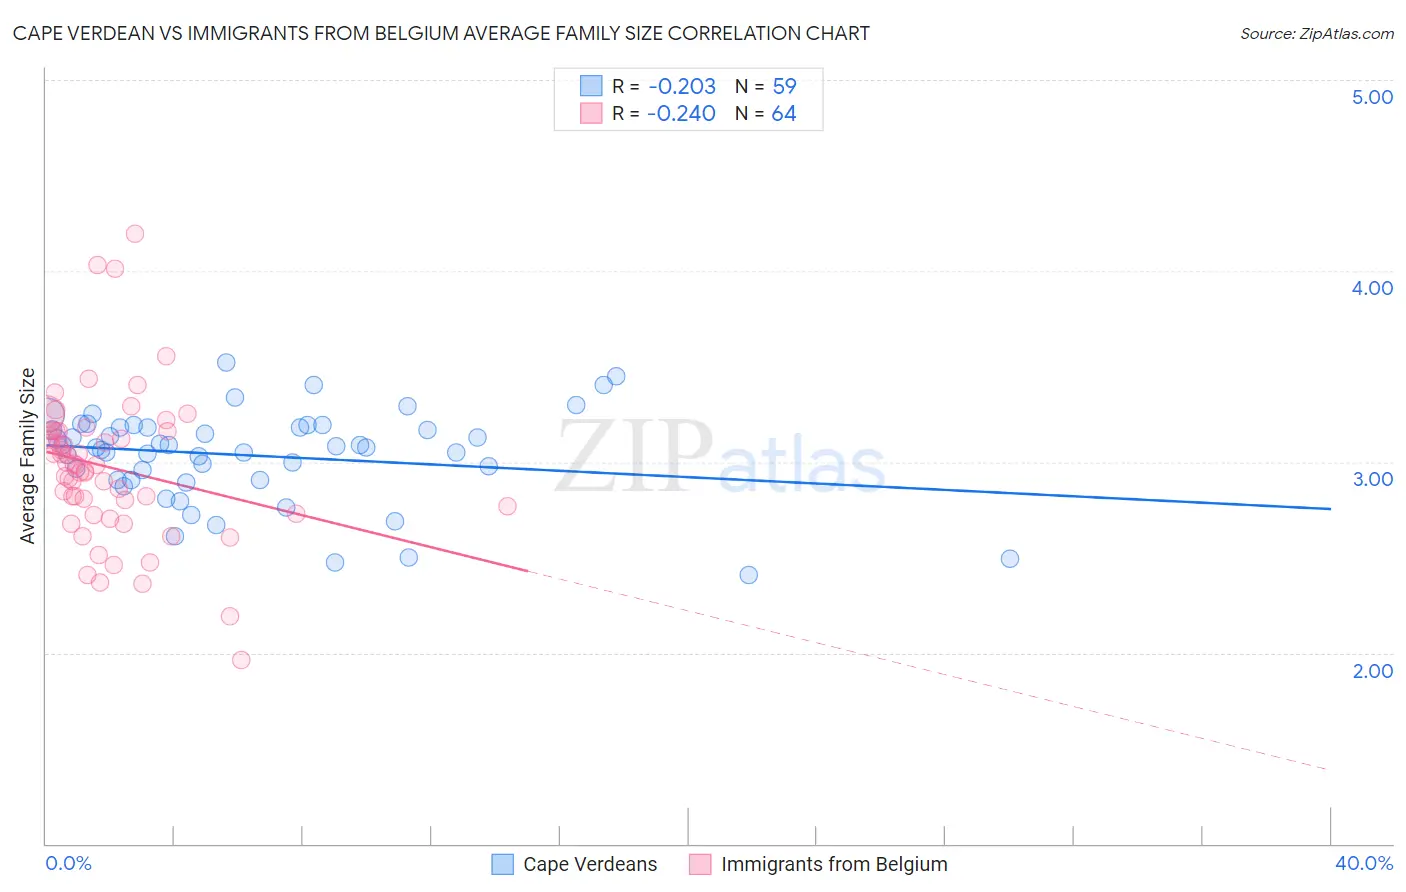
Cape Verdean vs Immigrants from Belgium Average Family Size Correlation Chart
The statistical analysis conducted on geographies consisting of 107,550,345 people shows a weak negative correlation between the proportion of Cape Verdeans and average family size in the United States with a correlation coefficient (R) of -0.203 and weighted average of 3.17. Similarly, the statistical analysis conducted on geographies consisting of 146,697,928 people shows a weak negative correlation between the proportion of Immigrants from Belgium and average family size in the United States with a correlation coefficient (R) of -0.240 and weighted average of 3.15, a difference of 0.46%.
Average Family Size Correlation Summary
| Measurement | Cape Verdean | Immigrants from Belgium |
| Minimum | 2.41 | 1.96 |
| Maximum | 3.52 | 4.19 |
| Range | 1.11 | 2.23 |
| Mean | 3.03 | 2.97 |
| Median | 3.08 | 2.98 |
| Interquartile 25% (IQ1) | 2.91 | 2.75 |
| Interquartile 75% (IQ3) | 3.18 | 3.16 |
| Interquartile Range (IQR) | 0.27 | 0.41 |
| Standard Deviation (Sample) | 0.24 | 0.39 |
| Standard Deviation (Population) | 0.24 | 0.39 |
Demographics Similar to Cape Verdeans and Immigrants from Belgium by Average Family Size
In terms of average family size, the demographic groups most similar to Cape Verdeans are Immigrants from Hungary (3.17, a difference of 0.010%), Immigrants from Kazakhstan (3.17, a difference of 0.030%), Albanian (3.17, a difference of 0.050%), Turkish (3.16, a difference of 0.10%), and Potawatomi (3.16, a difference of 0.11%). Similarly, the demographic groups most similar to Immigrants from Belgium are New Zealander (3.15, a difference of 0.0%), Immigrants from Lithuania (3.15, a difference of 0.020%), Immigrants from Germany (3.15, a difference of 0.030%), Tlingit-Haida (3.16, a difference of 0.060%), and Immigrants from Singapore (3.16, a difference of 0.090%).
| Demographics | Rating | Rank | Average Family Size |
| Immigrants | Hungary | 1.7 /100 | #254 | Tragic 3.17 |
| Cape Verdeans | 1.6 /100 | #255 | Tragic 3.17 |
| Immigrants | Kazakhstan | 1.5 /100 | #256 | Tragic 3.17 |
| Albanians | 1.5 /100 | #257 | Tragic 3.17 |
| Turks | 1.3 /100 | #258 | Tragic 3.16 |
| Potawatomi | 1.3 /100 | #259 | Tragic 3.16 |
| Immigrants | Albania | 1.3 /100 | #260 | Tragic 3.16 |
| Immigrants | North Macedonia | 1.3 /100 | #261 | Tragic 3.16 |
| Immigrants | Russia | 1.3 /100 | #262 | Tragic 3.16 |
| Immigrants | Bulgaria | 1.0 /100 | #263 | Tragic 3.16 |
| Americans | 1.0 /100 | #264 | Tragic 3.16 |
| Immigrants | South Africa | 0.9 /100 | #265 | Tragic 3.16 |
| Immigrants | Greece | 0.9 /100 | #266 | Tragic 3.16 |
| Iroquois | 0.8 /100 | #267 | Tragic 3.16 |
| Maltese | 0.8 /100 | #268 | Tragic 3.16 |
| Immigrants | Singapore | 0.7 /100 | #269 | Tragic 3.16 |
| Tlingit-Haida | 0.7 /100 | #270 | Tragic 3.16 |
| Immigrants | Germany | 0.7 /100 | #271 | Tragic 3.15 |
| Immigrants | Lithuania | 0.6 /100 | #272 | Tragic 3.15 |
| New Zealanders | 0.6 /100 | #273 | Tragic 3.15 |
| Immigrants | Belgium | 0.6 /100 | #274 | Tragic 3.15 |