Native/Alaskan vs Scandinavian Single Father Households
COMPARE
Native/Alaskan
Scandinavian
Single Father Households
Single Father Households Comparison
Natives/Alaskans
Scandinavians
3.2%
SINGLE FATHER HOUSEHOLDS
0.0/ 100
METRIC RATING
333rd/ 347
METRIC RANK
2.4%
SINGLE FATHER HOUSEHOLDS
27.4/ 100
METRIC RATING
198th/ 347
METRIC RANK
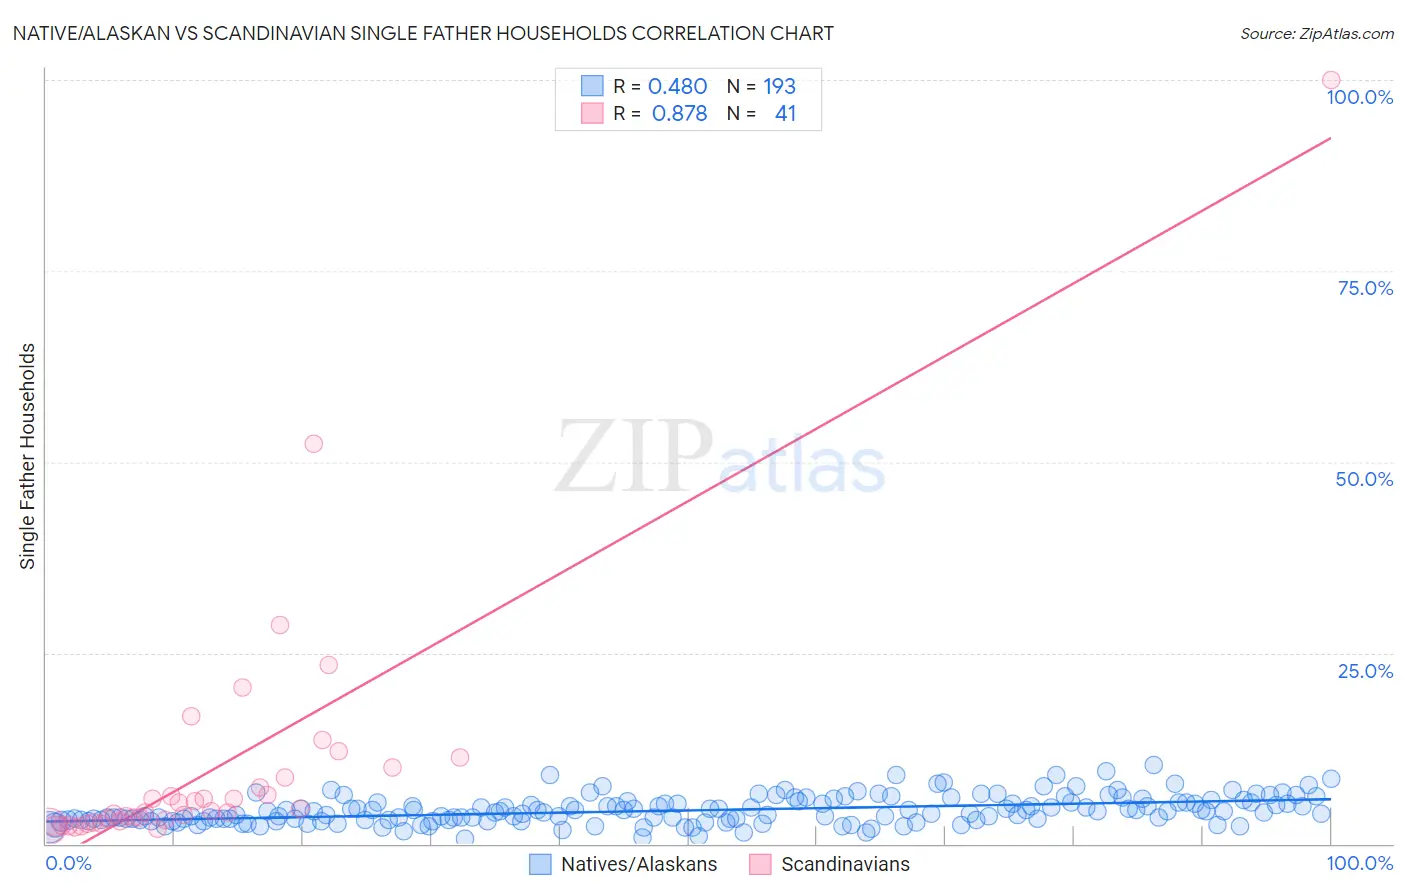
Native/Alaskan vs Scandinavian Single Father Households Correlation Chart
The statistical analysis conducted on geographies consisting of 505,226,319 people shows a moderate positive correlation between the proportion of Natives/Alaskans and percentage of single father households in the United States with a correlation coefficient (R) of 0.480 and weighted average of 3.2%. Similarly, the statistical analysis conducted on geographies consisting of 465,605,618 people shows a very strong positive correlation between the proportion of Scandinavians and percentage of single father households in the United States with a correlation coefficient (R) of 0.878 and weighted average of 2.4%, a difference of 34.7%.
Single Father Households Correlation Summary
| Measurement | Native/Alaskan | Scandinavian |
| Minimum | 0.64% | 1.9% |
| Maximum | 10.3% | 100.0% |
| Range | 9.6% | 98.1% |
| Mean | 4.4% | 10.1% |
| Median | 4.1% | 4.3% |
| Interquartile 25% (IQ1) | 3.1% | 2.9% |
| Interquartile 75% (IQ3) | 5.4% | 9.3% |
| Interquartile Range (IQR) | 2.3% | 6.5% |
| Standard Deviation (Sample) | 1.8% | 17.2% |
| Standard Deviation (Population) | 1.8% | 16.9% |
Similar Demographics by Single Father Households
Demographics Similar to Natives/Alaskans by Single Father Households
In terms of single father households, the demographic groups most similar to Natives/Alaskans are Yaqui (3.2%, a difference of 0.49%), Navajo (3.2%, a difference of 0.54%), Yuman (3.3%, a difference of 2.8%), Colville (3.3%, a difference of 2.8%), and Paiute (3.3%, a difference of 2.8%).
| Demographics | Rating | Rank | Single Father Households |
| Aleuts | 0.0 /100 | #326 | Tragic 3.0% |
| Bangladeshis | 0.0 /100 | #327 | Tragic 3.1% |
| Immigrants | Cabo Verde | 0.0 /100 | #328 | Tragic 3.1% |
| Chippewa | 0.0 /100 | #329 | Tragic 3.1% |
| Nepalese | 0.0 /100 | #330 | Tragic 3.1% |
| Navajo | 0.0 /100 | #331 | Tragic 3.2% |
| Yaqui | 0.0 /100 | #332 | Tragic 3.2% |
| Natives/Alaskans | 0.0 /100 | #333 | Tragic 3.2% |
| Yuman | 0.0 /100 | #334 | Tragic 3.3% |
| Colville | 0.0 /100 | #335 | Tragic 3.3% |
| Paiute | 0.0 /100 | #336 | Tragic 3.3% |
| Pueblo | 0.0 /100 | #337 | Tragic 3.3% |
| Sioux | 0.0 /100 | #338 | Tragic 3.3% |
| Alaskan Athabascans | 0.0 /100 | #339 | Tragic 3.4% |
| Alaska Natives | 0.0 /100 | #340 | Tragic 3.5% |
Demographics Similar to Scandinavians by Single Father Households
In terms of single father households, the demographic groups most similar to Scandinavians are Immigrants from Vietnam (2.4%, a difference of 0.030%), Peruvian (2.4%, a difference of 0.030%), German (2.4%, a difference of 0.050%), Kenyan (2.4%, a difference of 0.060%), and Immigrants from Philippines (2.4%, a difference of 0.11%).
| Demographics | Rating | Rank | Single Father Households |
| Immigrants | Africa | 30.0 /100 | #191 | Fair 2.4% |
| Immigrants | Sudan | 29.8 /100 | #192 | Fair 2.4% |
| Uruguayans | 29.7 /100 | #193 | Fair 2.4% |
| Panamanians | 29.6 /100 | #194 | Fair 2.4% |
| Immigrants | Philippines | 28.7 /100 | #195 | Fair 2.4% |
| Kenyans | 28.0 /100 | #196 | Fair 2.4% |
| Germans | 28.0 /100 | #197 | Fair 2.4% |
| Scandinavians | 27.4 /100 | #198 | Fair 2.4% |
| Immigrants | Vietnam | 27.1 /100 | #199 | Fair 2.4% |
| Peruvians | 27.1 /100 | #200 | Fair 2.4% |
| Immigrants | Uganda | 26.0 /100 | #201 | Fair 2.4% |
| German Russians | 25.7 /100 | #202 | Fair 2.4% |
| French Canadians | 24.7 /100 | #203 | Fair 2.4% |
| Ecuadorians | 24.5 /100 | #204 | Fair 2.4% |
| Immigrants | Afghanistan | 24.2 /100 | #205 | Fair 2.4% |