Sudanese vs Immigrants from Dominica Single Father Households
COMPARE
Sudanese
Immigrants from Dominica
Single Father Households
Single Father Households Comparison
Sudanese
Immigrants from Dominica
2.4%
SINGLE FATHER HOUSEHOLDS
13.0/ 100
METRIC RATING
219th/ 347
METRIC RANK
2.5%
SINGLE FATHER HOUSEHOLDS
4.8/ 100
METRIC RATING
240th/ 347
METRIC RANK
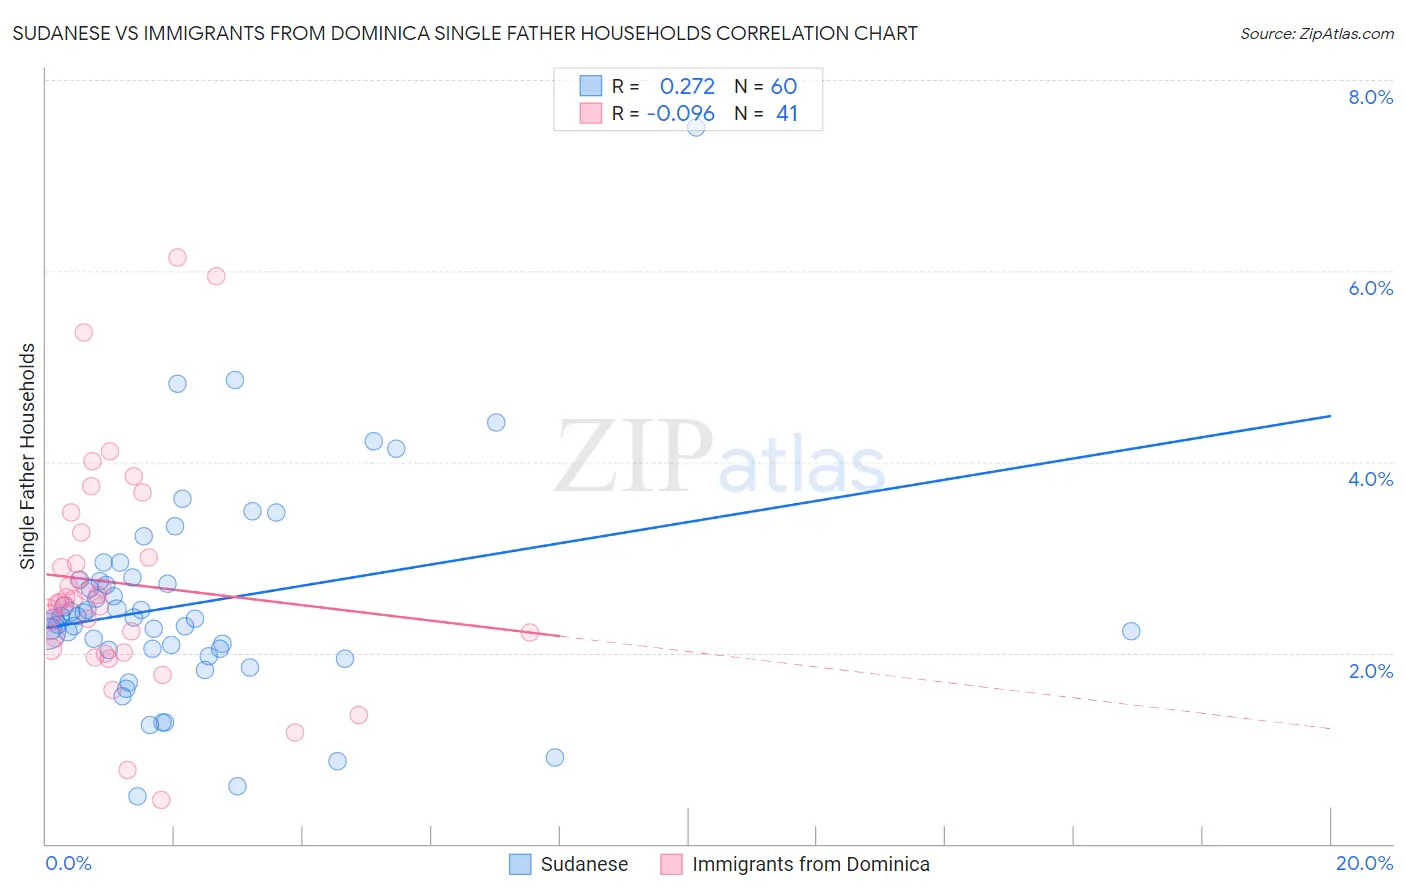
Sudanese vs Immigrants from Dominica Single Father Households Correlation Chart
The statistical analysis conducted on geographies consisting of 109,938,737 people shows a weak positive correlation between the proportion of Sudanese and percentage of single father households in the United States with a correlation coefficient (R) of 0.272 and weighted average of 2.4%. Similarly, the statistical analysis conducted on geographies consisting of 83,648,183 people shows a slight negative correlation between the proportion of Immigrants from Dominica and percentage of single father households in the United States with a correlation coefficient (R) of -0.096 and weighted average of 2.5%, a difference of 1.9%.
Single Father Households Correlation Summary
| Measurement | Sudanese | Immigrants from Dominica |
| Minimum | 0.49% | 0.46% |
| Maximum | 7.5% | 6.1% |
| Range | 7.0% | 5.7% |
| Mean | 2.5% | 2.7% |
| Median | 2.4% | 2.5% |
| Interquartile 25% (IQ1) | 2.0% | 2.0% |
| Interquartile 75% (IQ3) | 2.8% | 3.1% |
| Interquartile Range (IQR) | 0.73% | 1.1% |
| Standard Deviation (Sample) | 1.1% | 1.2% |
| Standard Deviation (Population) | 1.1% | 1.2% |
Similar Demographics by Single Father Households
Demographics Similar to Sudanese by Single Father Households
In terms of single father households, the demographic groups most similar to Sudanese are Ghanaian (2.4%, a difference of 0.010%), Immigrants from Ethiopia (2.4%, a difference of 0.070%), Immigrants from Burma/Myanmar (2.4%, a difference of 0.14%), Immigrants from Eastern Africa (2.4%, a difference of 0.17%), and Dutch (2.4%, a difference of 0.20%).
| Demographics | Rating | Rank | Single Father Households |
| Finns | 18.3 /100 | #212 | Poor 2.4% |
| Norwegians | 17.1 /100 | #213 | Poor 2.4% |
| Ethiopians | 16.6 /100 | #214 | Poor 2.4% |
| Immigrants | South Eastern Asia | 15.9 /100 | #215 | Poor 2.4% |
| Immigrants | Ecuador | 14.9 /100 | #216 | Poor 2.4% |
| Dutch | 14.3 /100 | #217 | Poor 2.4% |
| Immigrants | Ethiopia | 13.4 /100 | #218 | Poor 2.4% |
| Sudanese | 13.0 /100 | #219 | Poor 2.4% |
| Ghanaians | 12.9 /100 | #220 | Poor 2.4% |
| Immigrants | Burma/Myanmar | 12.1 /100 | #221 | Poor 2.4% |
| Immigrants | Eastern Africa | 11.9 /100 | #222 | Poor 2.4% |
| Immigrants | Uruguay | 11.0 /100 | #223 | Poor 2.4% |
| Immigrants | Bahamas | 10.6 /100 | #224 | Poor 2.4% |
| Marshallese | 9.7 /100 | #225 | Tragic 2.4% |
| Blacks/African Americans | 9.7 /100 | #226 | Tragic 2.4% |
Demographics Similar to Immigrants from Dominica by Single Father Households
In terms of single father households, the demographic groups most similar to Immigrants from Dominica are Portuguese (2.5%, a difference of 0.26%), Osage (2.5%, a difference of 0.29%), Immigrants from Oceania (2.5%, a difference of 0.36%), Immigrants from Sierra Leone (2.5%, a difference of 0.37%), and Sierra Leonean (2.5%, a difference of 0.41%).
| Demographics | Rating | Rank | Single Father Households |
| Immigrants | Western Africa | 7.0 /100 | #233 | Tragic 2.4% |
| Africans | 6.3 /100 | #234 | Tragic 2.5% |
| Immigrants | Immigrants | 6.3 /100 | #235 | Tragic 2.5% |
| Cajuns | 6.1 /100 | #236 | Tragic 2.5% |
| Sierra Leoneans | 5.9 /100 | #237 | Tragic 2.5% |
| Immigrants | Sierra Leone | 5.8 /100 | #238 | Tragic 2.5% |
| Immigrants | Oceania | 5.8 /100 | #239 | Tragic 2.5% |
| Immigrants | Dominica | 4.8 /100 | #240 | Tragic 2.5% |
| Portuguese | 4.1 /100 | #241 | Tragic 2.5% |
| Osage | 4.1 /100 | #242 | Tragic 2.5% |
| Spaniards | 3.1 /100 | #243 | Tragic 2.5% |
| Immigrants | Middle Africa | 2.8 /100 | #244 | Tragic 2.5% |
| Basques | 2.5 /100 | #245 | Tragic 2.5% |
| Native Hawaiians | 2.5 /100 | #246 | Tragic 2.5% |
| Delaware | 2.5 /100 | #247 | Tragic 2.5% |