Sudanese vs Immigrants from Argentina Single Father Households
COMPARE
Sudanese
Immigrants from Argentina
Single Father Households
Single Father Households Comparison
Sudanese
Immigrants from Argentina
2.4%
SINGLE FATHER HOUSEHOLDS
13.0/ 100
METRIC RATING
219th/ 347
METRIC RANK
2.2%
SINGLE FATHER HOUSEHOLDS
98.1/ 100
METRIC RATING
116th/ 347
METRIC RANK
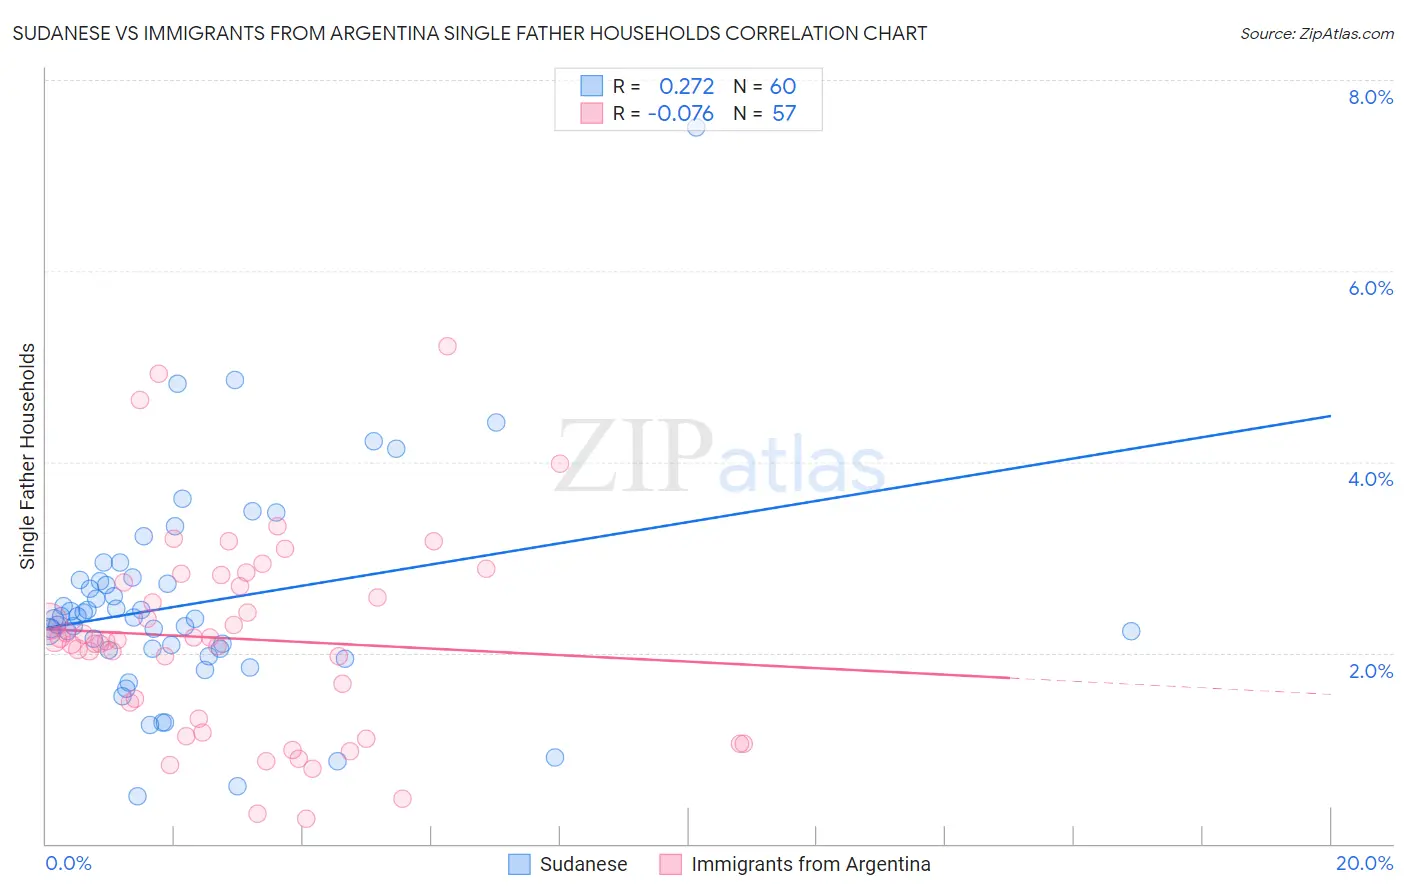
Sudanese vs Immigrants from Argentina Single Father Households Correlation Chart
The statistical analysis conducted on geographies consisting of 109,938,737 people shows a weak positive correlation between the proportion of Sudanese and percentage of single father households in the United States with a correlation coefficient (R) of 0.272 and weighted average of 2.4%. Similarly, the statistical analysis conducted on geographies consisting of 263,186,276 people shows a slight negative correlation between the proportion of Immigrants from Argentina and percentage of single father households in the United States with a correlation coefficient (R) of -0.076 and weighted average of 2.2%, a difference of 11.6%.
Single Father Households Correlation Summary
| Measurement | Sudanese | Immigrants from Argentina |
| Minimum | 0.49% | 0.26% |
| Maximum | 7.5% | 5.2% |
| Range | 7.0% | 5.0% |
| Mean | 2.5% | 2.1% |
| Median | 2.4% | 2.1% |
| Interquartile 25% (IQ1) | 2.0% | 1.2% |
| Interquartile 75% (IQ3) | 2.8% | 2.8% |
| Interquartile Range (IQR) | 0.73% | 1.5% |
| Standard Deviation (Sample) | 1.1% | 1.1% |
| Standard Deviation (Population) | 1.1% | 1.0% |
Similar Demographics by Single Father Households
Demographics Similar to Sudanese by Single Father Households
In terms of single father households, the demographic groups most similar to Sudanese are Ghanaian (2.4%, a difference of 0.010%), Immigrants from Ethiopia (2.4%, a difference of 0.070%), Immigrants from Burma/Myanmar (2.4%, a difference of 0.14%), Immigrants from Eastern Africa (2.4%, a difference of 0.17%), and Dutch (2.4%, a difference of 0.20%).
| Demographics | Rating | Rank | Single Father Households |
| Finns | 18.3 /100 | #212 | Poor 2.4% |
| Norwegians | 17.1 /100 | #213 | Poor 2.4% |
| Ethiopians | 16.6 /100 | #214 | Poor 2.4% |
| Immigrants | South Eastern Asia | 15.9 /100 | #215 | Poor 2.4% |
| Immigrants | Ecuador | 14.9 /100 | #216 | Poor 2.4% |
| Dutch | 14.3 /100 | #217 | Poor 2.4% |
| Immigrants | Ethiopia | 13.4 /100 | #218 | Poor 2.4% |
| Sudanese | 13.0 /100 | #219 | Poor 2.4% |
| Ghanaians | 12.9 /100 | #220 | Poor 2.4% |
| Immigrants | Burma/Myanmar | 12.1 /100 | #221 | Poor 2.4% |
| Immigrants | Eastern Africa | 11.9 /100 | #222 | Poor 2.4% |
| Immigrants | Uruguay | 11.0 /100 | #223 | Poor 2.4% |
| Immigrants | Bahamas | 10.6 /100 | #224 | Poor 2.4% |
| Marshallese | 9.7 /100 | #225 | Tragic 2.4% |
| Blacks/African Americans | 9.7 /100 | #226 | Tragic 2.4% |
Demographics Similar to Immigrants from Argentina by Single Father Households
In terms of single father households, the demographic groups most similar to Immigrants from Argentina are Immigrants from Barbados (2.2%, a difference of 0.030%), Immigrants from North America (2.2%, a difference of 0.060%), Iraqi (2.2%, a difference of 0.10%), Immigrants from Trinidad and Tobago (2.2%, a difference of 0.11%), and Immigrants from Canada (2.2%, a difference of 0.15%).
| Demographics | Rating | Rank | Single Father Households |
| Barbadians | 98.4 /100 | #109 | Exceptional 2.2% |
| Italians | 98.3 /100 | #110 | Exceptional 2.2% |
| Immigrants | Canada | 98.3 /100 | #111 | Exceptional 2.2% |
| Immigrants | Trinidad and Tobago | 98.2 /100 | #112 | Exceptional 2.2% |
| Iraqis | 98.2 /100 | #113 | Exceptional 2.2% |
| Immigrants | North America | 98.2 /100 | #114 | Exceptional 2.2% |
| Immigrants | Barbados | 98.2 /100 | #115 | Exceptional 2.2% |
| Immigrants | Argentina | 98.1 /100 | #116 | Exceptional 2.2% |
| Hungarians | 97.9 /100 | #117 | Exceptional 2.2% |
| Immigrants | Morocco | 97.8 /100 | #118 | Exceptional 2.2% |
| Trinidadians and Tobagonians | 97.8 /100 | #119 | Exceptional 2.2% |
| Australians | 97.7 /100 | #120 | Exceptional 2.2% |
| Immigrants | Brazil | 97.7 /100 | #121 | Exceptional 2.2% |
| Immigrants | Iraq | 97.6 /100 | #122 | Exceptional 2.2% |
| Immigrants | Yemen | 97.5 /100 | #123 | Exceptional 2.2% |