Scotch-Irish vs Scandinavian Single Father Households
COMPARE
Scotch-Irish
Scandinavian
Single Father Households
Single Father Households Comparison
Scotch-Irish
Scandinavians
2.3%
SINGLE FATHER HOUSEHOLDS
69.4/ 100
METRIC RATING
165th/ 347
METRIC RANK
2.4%
SINGLE FATHER HOUSEHOLDS
27.4/ 100
METRIC RATING
198th/ 347
METRIC RANK
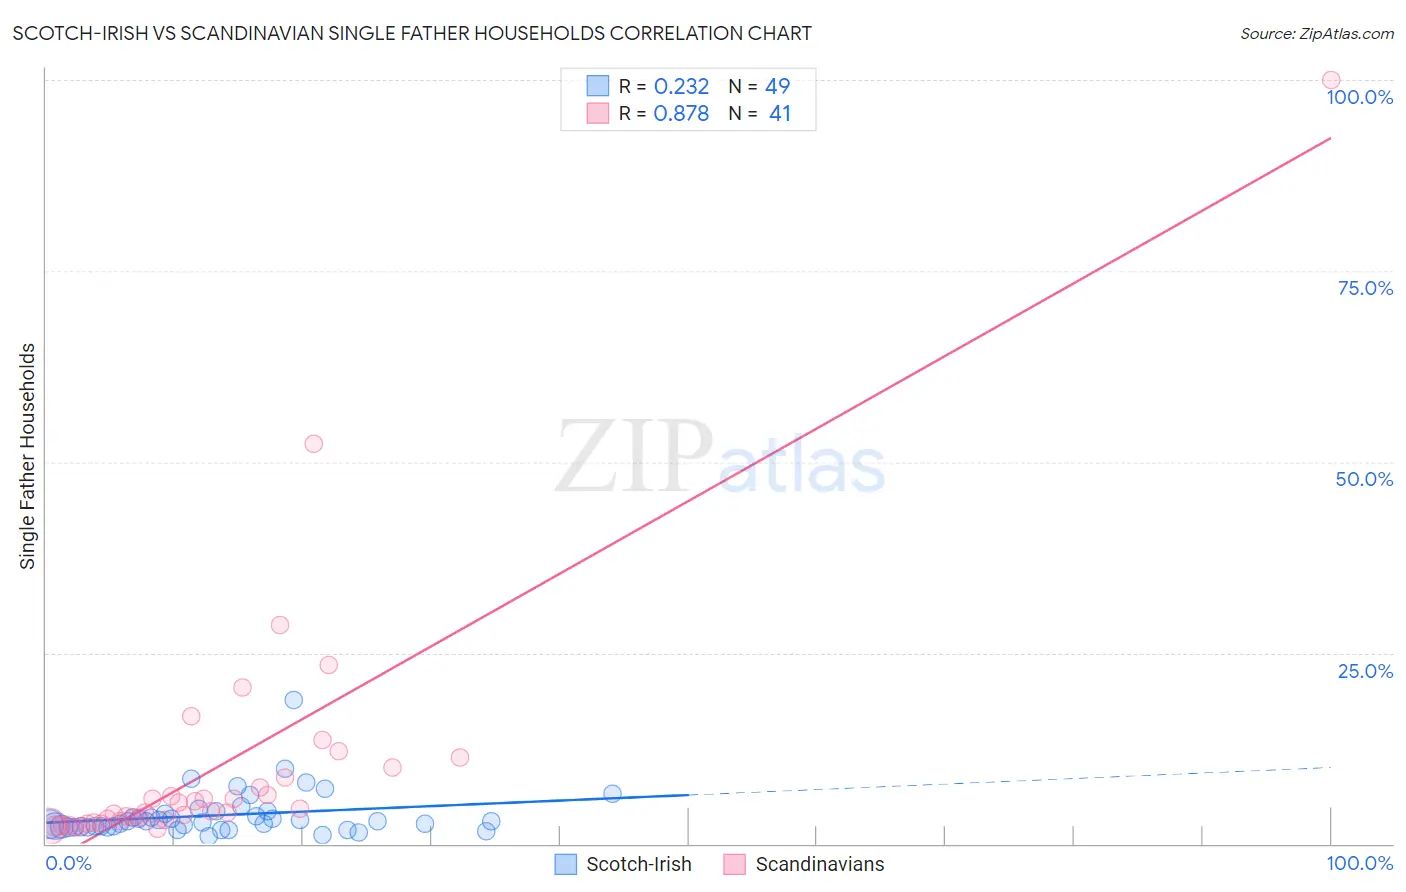
Scotch-Irish vs Scandinavian Single Father Households Correlation Chart
The statistical analysis conducted on geographies consisting of 535,957,408 people shows a weak positive correlation between the proportion of Scotch-Irish and percentage of single father households in the United States with a correlation coefficient (R) of 0.232 and weighted average of 2.3%. Similarly, the statistical analysis conducted on geographies consisting of 465,605,618 people shows a very strong positive correlation between the proportion of Scandinavians and percentage of single father households in the United States with a correlation coefficient (R) of 0.878 and weighted average of 2.4%, a difference of 3.4%.
Single Father Households Correlation Summary
| Measurement | Scotch-Irish | Scandinavian |
| Minimum | 0.96% | 1.9% |
| Maximum | 18.9% | 100.0% |
| Range | 17.9% | 98.1% |
| Mean | 3.7% | 10.1% |
| Median | 2.9% | 4.3% |
| Interquartile 25% (IQ1) | 2.2% | 2.9% |
| Interquartile 75% (IQ3) | 4.1% | 9.3% |
| Interquartile Range (IQR) | 1.9% | 6.5% |
| Standard Deviation (Sample) | 3.0% | 17.2% |
| Standard Deviation (Population) | 3.0% | 16.9% |
Similar Demographics by Single Father Households
Demographics Similar to Scotch-Irish by Single Father Households
In terms of single father households, the demographic groups most similar to Scotch-Irish are English (2.3%, a difference of 0.070%), Pakistani (2.3%, a difference of 0.10%), Irish (2.3%, a difference of 0.24%), Scottish (2.3%, a difference of 0.31%), and Swiss (2.3%, a difference of 0.35%).
| Demographics | Rating | Rank | Single Father Households |
| Immigrants | Senegal | 79.4 /100 | #158 | Good 2.3% |
| Immigrants | West Indies | 77.9 /100 | #159 | Good 2.3% |
| Immigrants | Bolivia | 76.3 /100 | #160 | Good 2.3% |
| Swiss | 73.2 /100 | #161 | Good 2.3% |
| Scottish | 72.8 /100 | #162 | Good 2.3% |
| Irish | 72.1 /100 | #163 | Good 2.3% |
| Pakistanis | 70.6 /100 | #164 | Good 2.3% |
| Scotch-Irish | 69.4 /100 | #165 | Good 2.3% |
| English | 68.6 /100 | #166 | Good 2.3% |
| South Americans | 64.3 /100 | #167 | Good 2.3% |
| Icelanders | 63.1 /100 | #168 | Good 2.3% |
| Czechs | 62.5 /100 | #169 | Good 2.3% |
| Ugandans | 62.2 /100 | #170 | Good 2.3% |
| Swedes | 61.6 /100 | #171 | Good 2.3% |
| Czechoslovakians | 58.9 /100 | #172 | Average 2.3% |
Demographics Similar to Scandinavians by Single Father Households
In terms of single father households, the demographic groups most similar to Scandinavians are Immigrants from Vietnam (2.4%, a difference of 0.030%), Peruvian (2.4%, a difference of 0.030%), German (2.4%, a difference of 0.050%), Kenyan (2.4%, a difference of 0.060%), and Immigrants from Philippines (2.4%, a difference of 0.11%).
| Demographics | Rating | Rank | Single Father Households |
| Immigrants | Africa | 30.0 /100 | #191 | Fair 2.4% |
| Immigrants | Sudan | 29.8 /100 | #192 | Fair 2.4% |
| Uruguayans | 29.7 /100 | #193 | Fair 2.4% |
| Panamanians | 29.6 /100 | #194 | Fair 2.4% |
| Immigrants | Philippines | 28.7 /100 | #195 | Fair 2.4% |
| Kenyans | 28.0 /100 | #196 | Fair 2.4% |
| Germans | 28.0 /100 | #197 | Fair 2.4% |
| Scandinavians | 27.4 /100 | #198 | Fair 2.4% |
| Immigrants | Vietnam | 27.1 /100 | #199 | Fair 2.4% |
| Peruvians | 27.1 /100 | #200 | Fair 2.4% |
| Immigrants | Uganda | 26.0 /100 | #201 | Fair 2.4% |
| German Russians | 25.7 /100 | #202 | Fair 2.4% |
| French Canadians | 24.7 /100 | #203 | Fair 2.4% |
| Ecuadorians | 24.5 /100 | #204 | Fair 2.4% |
| Immigrants | Afghanistan | 24.2 /100 | #205 | Fair 2.4% |