Subsaharan African vs Immigrants from Trinidad and Tobago Single Mother Households
COMPARE
Subsaharan African
Immigrants from Trinidad and Tobago
Single Mother Households
Single Mother Households Comparison
Sub-Saharan Africans
Immigrants from Trinidad and Tobago
7.8%
SINGLE MOTHER HOUSEHOLDS
0.0/ 100
METRIC RATING
289th/ 347
METRIC RANK
7.6%
SINGLE MOTHER HOUSEHOLDS
0.1/ 100
METRIC RATING
277th/ 347
METRIC RANK
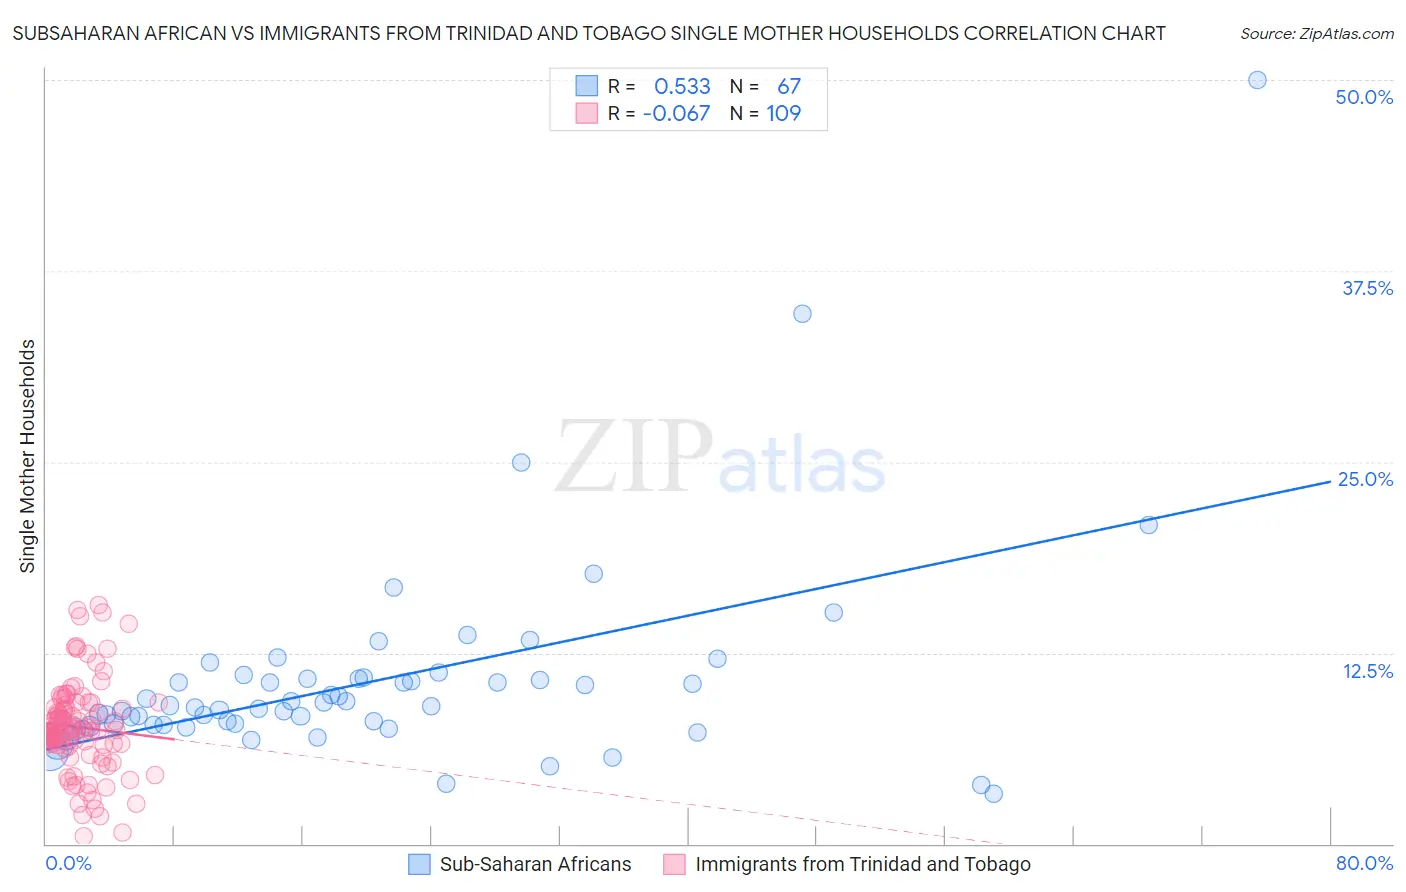
Subsaharan African vs Immigrants from Trinidad and Tobago Single Mother Households Correlation Chart
The statistical analysis conducted on geographies consisting of 505,994,563 people shows a substantial positive correlation between the proportion of Sub-Saharan Africans and percentage of single mother households in the United States with a correlation coefficient (R) of 0.533 and weighted average of 7.8%. Similarly, the statistical analysis conducted on geographies consisting of 223,270,530 people shows a slight negative correlation between the proportion of Immigrants from Trinidad and Tobago and percentage of single mother households in the United States with a correlation coefficient (R) of -0.067 and weighted average of 7.6%, a difference of 2.6%.
Single Mother Households Correlation Summary
| Measurement | Subsaharan African | Immigrants from Trinidad and Tobago |
| Minimum | 3.2% | 0.52% |
| Maximum | 50.0% | 15.6% |
| Range | 46.8% | 15.1% |
| Mean | 10.6% | 7.6% |
| Median | 9.0% | 7.4% |
| Interquartile 25% (IQ1) | 7.8% | 6.5% |
| Interquartile 75% (IQ3) | 10.8% | 9.0% |
| Interquartile Range (IQR) | 3.0% | 2.5% |
| Standard Deviation (Sample) | 6.8% | 3.0% |
| Standard Deviation (Population) | 6.7% | 3.0% |
Demographics Similar to Sub-Saharan Africans and Immigrants from Trinidad and Tobago by Single Mother Households
In terms of single mother households, the demographic groups most similar to Sub-Saharan Africans are Immigrants from Nigeria (7.8%, a difference of 0.42%), West Indian (7.8%, a difference of 0.50%), Ghanaian (7.8%, a difference of 0.51%), Immigrants from Cameroon (7.9%, a difference of 0.87%), and Sierra Leonean (7.7%, a difference of 0.92%). Similarly, the demographic groups most similar to Immigrants from Trinidad and Tobago are Central American (7.6%, a difference of 0.0%), Guyanese (7.6%, a difference of 0.040%), Immigrants from El Salvador (7.6%, a difference of 0.23%), Central American Indian (7.6%, a difference of 0.49%), and Immigrants from Guyana (7.6%, a difference of 0.59%).
| Demographics | Rating | Rank | Single Mother Households |
| Belizeans | 0.1 /100 | #273 | Tragic 7.6% |
| Immigrants | Guyana | 0.1 /100 | #274 | Tragic 7.6% |
| Central American Indians | 0.1 /100 | #275 | Tragic 7.6% |
| Guyanese | 0.1 /100 | #276 | Tragic 7.6% |
| Immigrants | Trinidad and Tobago | 0.1 /100 | #277 | Tragic 7.6% |
| Central Americans | 0.1 /100 | #278 | Tragic 7.6% |
| Immigrants | El Salvador | 0.0 /100 | #279 | Tragic 7.6% |
| Immigrants | Sierra Leone | 0.0 /100 | #280 | Tragic 7.7% |
| Immigrants | Laos | 0.0 /100 | #281 | Tragic 7.7% |
| Guatemalans | 0.0 /100 | #282 | Tragic 7.7% |
| Nigerians | 0.0 /100 | #283 | Tragic 7.7% |
| Immigrants | Belize | 0.0 /100 | #284 | Tragic 7.7% |
| Trinidadians and Tobagonians | 0.0 /100 | #285 | Tragic 7.7% |
| Immigrants | Middle Africa | 0.0 /100 | #286 | Tragic 7.7% |
| Immigrants | Guatemala | 0.0 /100 | #287 | Tragic 7.7% |
| Sierra Leoneans | 0.0 /100 | #288 | Tragic 7.7% |
| Sub-Saharan Africans | 0.0 /100 | #289 | Tragic 7.8% |
| Immigrants | Nigeria | 0.0 /100 | #290 | Tragic 7.8% |
| West Indians | 0.0 /100 | #291 | Tragic 7.8% |
| Ghanaians | 0.0 /100 | #292 | Tragic 7.8% |
| Immigrants | Cameroon | 0.0 /100 | #293 | Tragic 7.9% |