Subsaharan African vs Immigrants from Colombia Single Mother Households
COMPARE
Subsaharan African
Immigrants from Colombia
Single Mother Households
Single Mother Households Comparison
Sub-Saharan Africans
Immigrants from Colombia
7.8%
SINGLE MOTHER HOUSEHOLDS
0.0/ 100
METRIC RATING
289th/ 347
METRIC RANK
6.7%
SINGLE MOTHER HOUSEHOLDS
10.5/ 100
METRIC RATING
209th/ 347
METRIC RANK
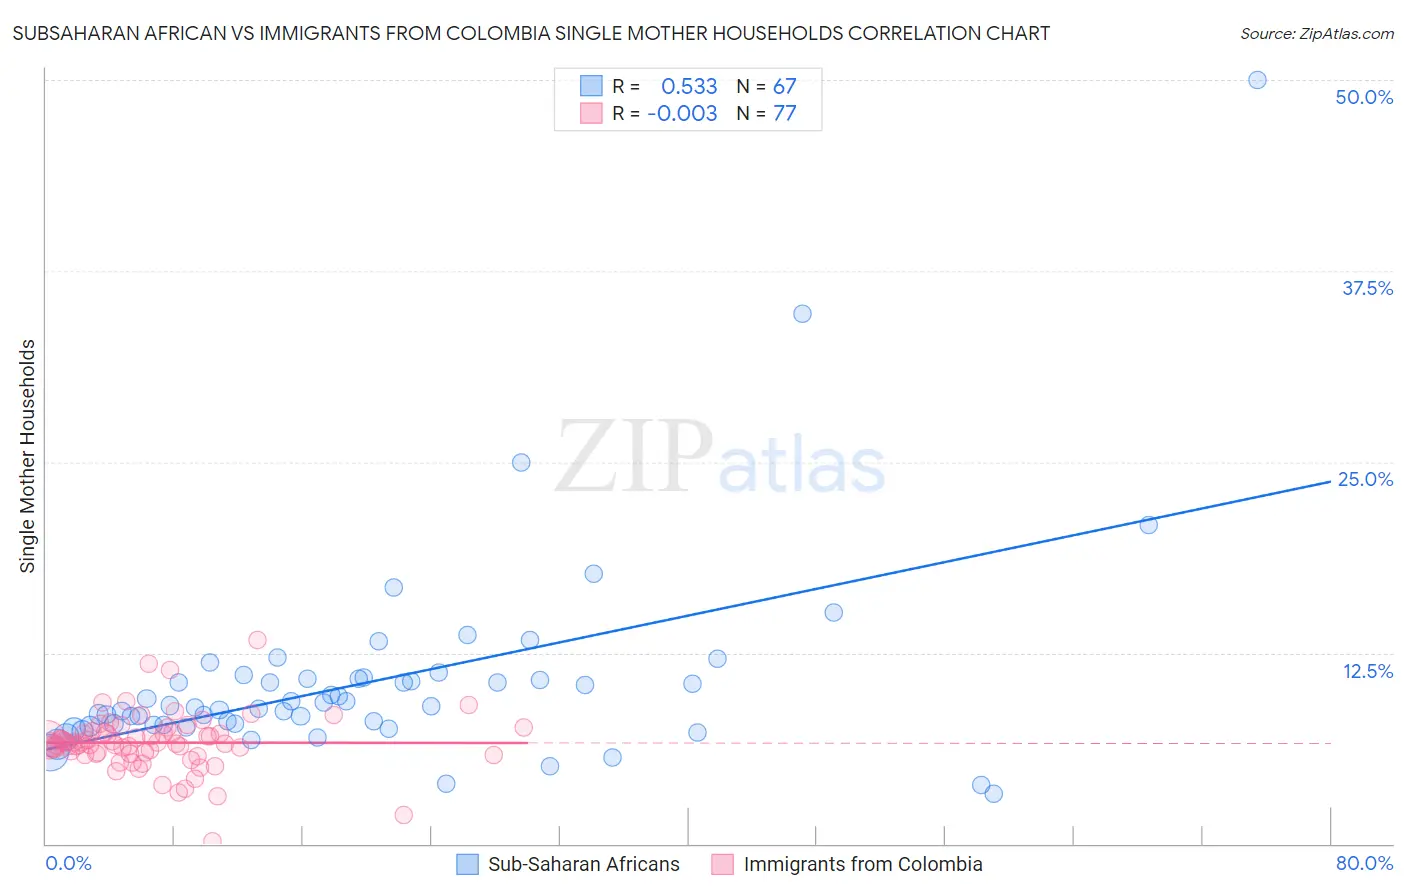
Subsaharan African vs Immigrants from Colombia Single Mother Households Correlation Chart
The statistical analysis conducted on geographies consisting of 505,994,563 people shows a substantial positive correlation between the proportion of Sub-Saharan Africans and percentage of single mother households in the United States with a correlation coefficient (R) of 0.533 and weighted average of 7.8%. Similarly, the statistical analysis conducted on geographies consisting of 377,860,755 people shows no correlation between the proportion of Immigrants from Colombia and percentage of single mother households in the United States with a correlation coefficient (R) of -0.003 and weighted average of 6.7%, a difference of 16.8%.
Single Mother Households Correlation Summary
| Measurement | Subsaharan African | Immigrants from Colombia |
| Minimum | 3.2% | 0.15% |
| Maximum | 50.0% | 13.3% |
| Range | 46.8% | 13.2% |
| Mean | 10.6% | 6.6% |
| Median | 9.0% | 6.6% |
| Interquartile 25% (IQ1) | 7.8% | 5.9% |
| Interquartile 75% (IQ3) | 10.8% | 7.3% |
| Interquartile Range (IQR) | 3.0% | 1.4% |
| Standard Deviation (Sample) | 6.8% | 1.9% |
| Standard Deviation (Population) | 6.7% | 1.9% |
Similar Demographics by Single Mother Households
Demographics Similar to Sub-Saharan Africans by Single Mother Households
In terms of single mother households, the demographic groups most similar to Sub-Saharan Africans are Immigrants from Nigeria (7.8%, a difference of 0.42%), West Indian (7.8%, a difference of 0.50%), Ghanaian (7.8%, a difference of 0.51%), Immigrants from Cameroon (7.9%, a difference of 0.87%), and Sierra Leonean (7.7%, a difference of 0.92%).
| Demographics | Rating | Rank | Single Mother Households |
| Guatemalans | 0.0 /100 | #282 | Tragic 7.7% |
| Nigerians | 0.0 /100 | #283 | Tragic 7.7% |
| Immigrants | Belize | 0.0 /100 | #284 | Tragic 7.7% |
| Trinidadians and Tobagonians | 0.0 /100 | #285 | Tragic 7.7% |
| Immigrants | Middle Africa | 0.0 /100 | #286 | Tragic 7.7% |
| Immigrants | Guatemala | 0.0 /100 | #287 | Tragic 7.7% |
| Sierra Leoneans | 0.0 /100 | #288 | Tragic 7.7% |
| Sub-Saharan Africans | 0.0 /100 | #289 | Tragic 7.8% |
| Immigrants | Nigeria | 0.0 /100 | #290 | Tragic 7.8% |
| West Indians | 0.0 /100 | #291 | Tragic 7.8% |
| Ghanaians | 0.0 /100 | #292 | Tragic 7.8% |
| Immigrants | Cameroon | 0.0 /100 | #293 | Tragic 7.9% |
| Apache | 0.0 /100 | #294 | Tragic 7.9% |
| Barbadians | 0.0 /100 | #295 | Tragic 7.9% |
| Immigrants | Latin America | 0.0 /100 | #296 | Tragic 7.9% |
Demographics Similar to Immigrants from Colombia by Single Mother Households
In terms of single mother households, the demographic groups most similar to Immigrants from Colombia are Nonimmigrants (6.7%, a difference of 0.020%), Vietnamese (6.7%, a difference of 0.21%), German Russian (6.7%, a difference of 0.27%), Immigrants from South America (6.7%, a difference of 0.27%), and Cree (6.7%, a difference of 0.35%).
| Demographics | Rating | Rank | Single Mother Households |
| Guamanians/Chamorros | 12.4 /100 | #202 | Poor 6.6% |
| Immigrants | Peru | 12.0 /100 | #203 | Poor 6.7% |
| Immigrants | Fiji | 11.9 /100 | #204 | Poor 6.7% |
| Cree | 11.9 /100 | #205 | Poor 6.7% |
| German Russians | 11.5 /100 | #206 | Poor 6.7% |
| Immigrants | South America | 11.5 /100 | #207 | Poor 6.7% |
| Vietnamese | 11.3 /100 | #208 | Poor 6.7% |
| Immigrants | Colombia | 10.5 /100 | #209 | Poor 6.7% |
| Immigrants | Nonimmigrants | 10.4 /100 | #210 | Poor 6.7% |
| Immigrants | Venezuela | 8.5 /100 | #211 | Tragic 6.7% |
| Immigrants | Eritrea | 8.4 /100 | #212 | Tragic 6.7% |
| Immigrants | Costa Rica | 8.2 /100 | #213 | Tragic 6.7% |
| Immigrants | Uruguay | 7.9 /100 | #214 | Tragic 6.7% |
| Shoshone | 5.7 /100 | #215 | Tragic 6.8% |
| Cherokee | 5.1 /100 | #216 | Tragic 6.8% |