Subsaharan African vs Sudanese Single Mother Households
COMPARE
Subsaharan African
Sudanese
Single Mother Households
Single Mother Households Comparison
Sub-Saharan Africans
Sudanese
7.8%
SINGLE MOTHER HOUSEHOLDS
0.0/ 100
METRIC RATING
289th/ 347
METRIC RANK
6.9%
SINGLE MOTHER HOUSEHOLDS
3.1/ 100
METRIC RATING
225th/ 347
METRIC RANK
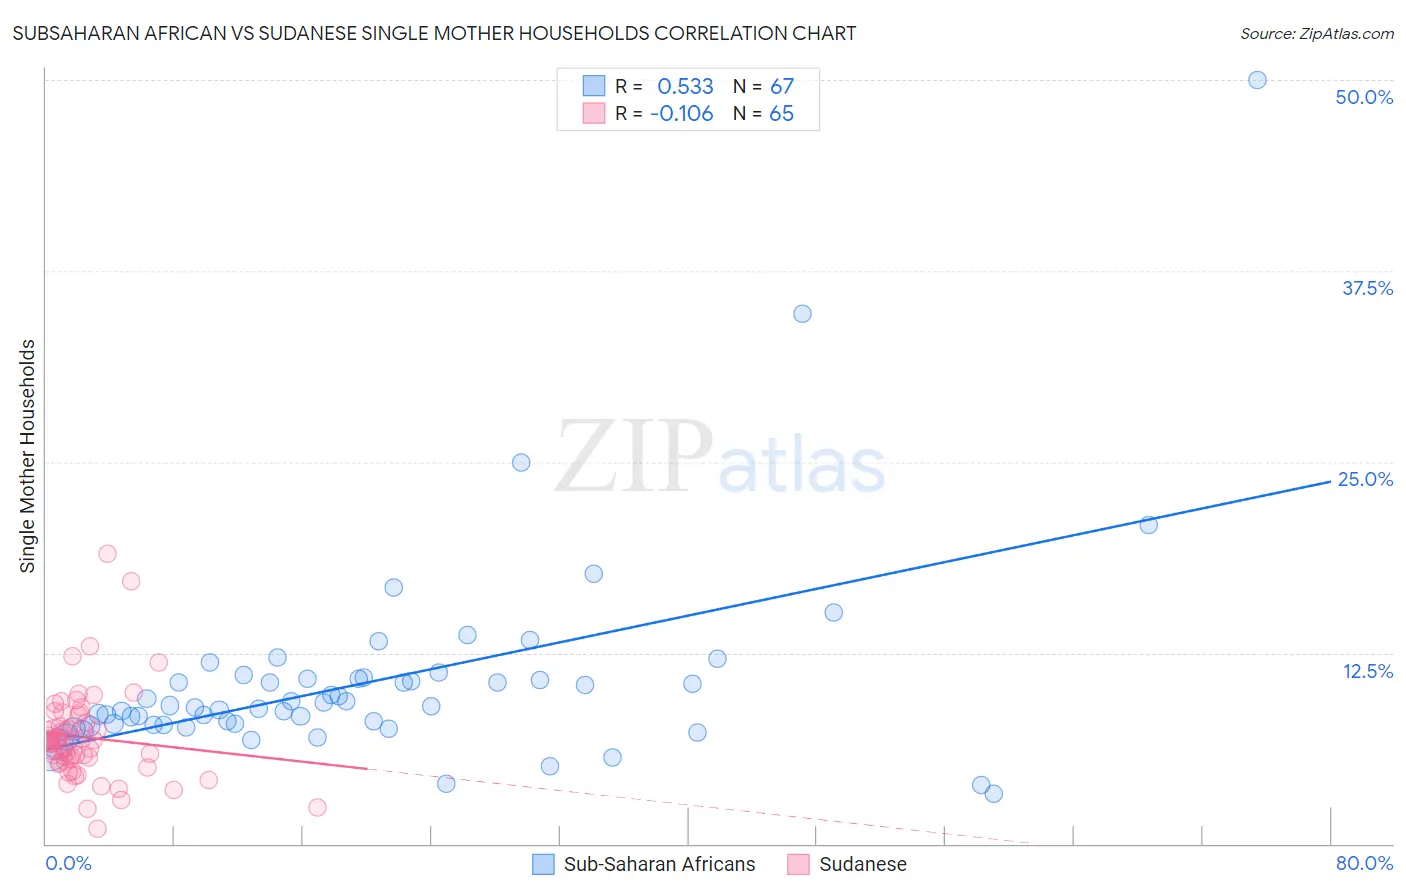
Subsaharan African vs Sudanese Single Mother Households Correlation Chart
The statistical analysis conducted on geographies consisting of 505,994,563 people shows a substantial positive correlation between the proportion of Sub-Saharan Africans and percentage of single mother households in the United States with a correlation coefficient (R) of 0.533 and weighted average of 7.8%. Similarly, the statistical analysis conducted on geographies consisting of 110,049,727 people shows a poor negative correlation between the proportion of Sudanese and percentage of single mother households in the United States with a correlation coefficient (R) of -0.106 and weighted average of 6.9%, a difference of 13.1%.
Single Mother Households Correlation Summary
| Measurement | Subsaharan African | Sudanese |
| Minimum | 3.2% | 1.0% |
| Maximum | 50.0% | 19.0% |
| Range | 46.8% | 18.0% |
| Mean | 10.6% | 7.0% |
| Median | 9.0% | 6.7% |
| Interquartile 25% (IQ1) | 7.8% | 5.4% |
| Interquartile 75% (IQ3) | 10.8% | 8.2% |
| Interquartile Range (IQR) | 3.0% | 2.8% |
| Standard Deviation (Sample) | 6.8% | 3.0% |
| Standard Deviation (Population) | 6.7% | 3.0% |
Similar Demographics by Single Mother Households
Demographics Similar to Sub-Saharan Africans by Single Mother Households
In terms of single mother households, the demographic groups most similar to Sub-Saharan Africans are Immigrants from Nigeria (7.8%, a difference of 0.42%), West Indian (7.8%, a difference of 0.50%), Ghanaian (7.8%, a difference of 0.51%), Immigrants from Cameroon (7.9%, a difference of 0.87%), and Sierra Leonean (7.7%, a difference of 0.92%).
| Demographics | Rating | Rank | Single Mother Households |
| Guatemalans | 0.0 /100 | #282 | Tragic 7.7% |
| Nigerians | 0.0 /100 | #283 | Tragic 7.7% |
| Immigrants | Belize | 0.0 /100 | #284 | Tragic 7.7% |
| Trinidadians and Tobagonians | 0.0 /100 | #285 | Tragic 7.7% |
| Immigrants | Middle Africa | 0.0 /100 | #286 | Tragic 7.7% |
| Immigrants | Guatemala | 0.0 /100 | #287 | Tragic 7.7% |
| Sierra Leoneans | 0.0 /100 | #288 | Tragic 7.7% |
| Sub-Saharan Africans | 0.0 /100 | #289 | Tragic 7.8% |
| Immigrants | Nigeria | 0.0 /100 | #290 | Tragic 7.8% |
| West Indians | 0.0 /100 | #291 | Tragic 7.8% |
| Ghanaians | 0.0 /100 | #292 | Tragic 7.8% |
| Immigrants | Cameroon | 0.0 /100 | #293 | Tragic 7.9% |
| Apache | 0.0 /100 | #294 | Tragic 7.9% |
| Barbadians | 0.0 /100 | #295 | Tragic 7.9% |
| Immigrants | Latin America | 0.0 /100 | #296 | Tragic 7.9% |
Demographics Similar to Sudanese by Single Mother Households
In terms of single mother households, the demographic groups most similar to Sudanese are Immigrants from Sudan (6.9%, a difference of 0.27%), Immigrants from Micronesia (6.9%, a difference of 0.39%), Immigrants from Bangladesh (6.9%, a difference of 0.44%), French American Indian (6.9%, a difference of 0.47%), and Immigrants from Thailand (6.9%, a difference of 0.66%).
| Demographics | Rating | Rank | Single Mother Households |
| Immigrants | Eastern Africa | 4.4 /100 | #218 | Tragic 6.8% |
| Immigrants | Immigrants | 4.3 /100 | #219 | Tragic 6.8% |
| Immigrants | Thailand | 4.0 /100 | #220 | Tragic 6.9% |
| French American Indians | 3.7 /100 | #221 | Tragic 6.9% |
| Immigrants | Bangladesh | 3.7 /100 | #222 | Tragic 6.9% |
| Immigrants | Micronesia | 3.6 /100 | #223 | Tragic 6.9% |
| Immigrants | Sudan | 3.5 /100 | #224 | Tragic 6.9% |
| Sudanese | 3.1 /100 | #225 | Tragic 6.9% |
| Paiute | 2.4 /100 | #226 | Tragic 7.0% |
| Kenyans | 2.3 /100 | #227 | Tragic 7.0% |
| Iroquois | 2.2 /100 | #228 | Tragic 7.0% |
| Immigrants | Kenya | 2.1 /100 | #229 | Tragic 7.0% |
| Creek | 1.6 /100 | #230 | Tragic 7.0% |
| Spanish Americans | 1.6 /100 | #231 | Tragic 7.0% |
| Comanche | 1.5 /100 | #232 | Tragic 7.0% |