Mexican vs Vietnamese Divorced or Separated
COMPARE
Mexican
Vietnamese
Divorced or Separated
Divorced or Separated Comparison
Mexicans
Vietnamese
12.2%
DIVORCED OR SEPARATED
21.0/ 100
METRIC RATING
207th/ 347
METRIC RANK
10.8%
DIVORCED OR SEPARATED
100.0/ 100
METRIC RATING
22nd/ 347
METRIC RANK
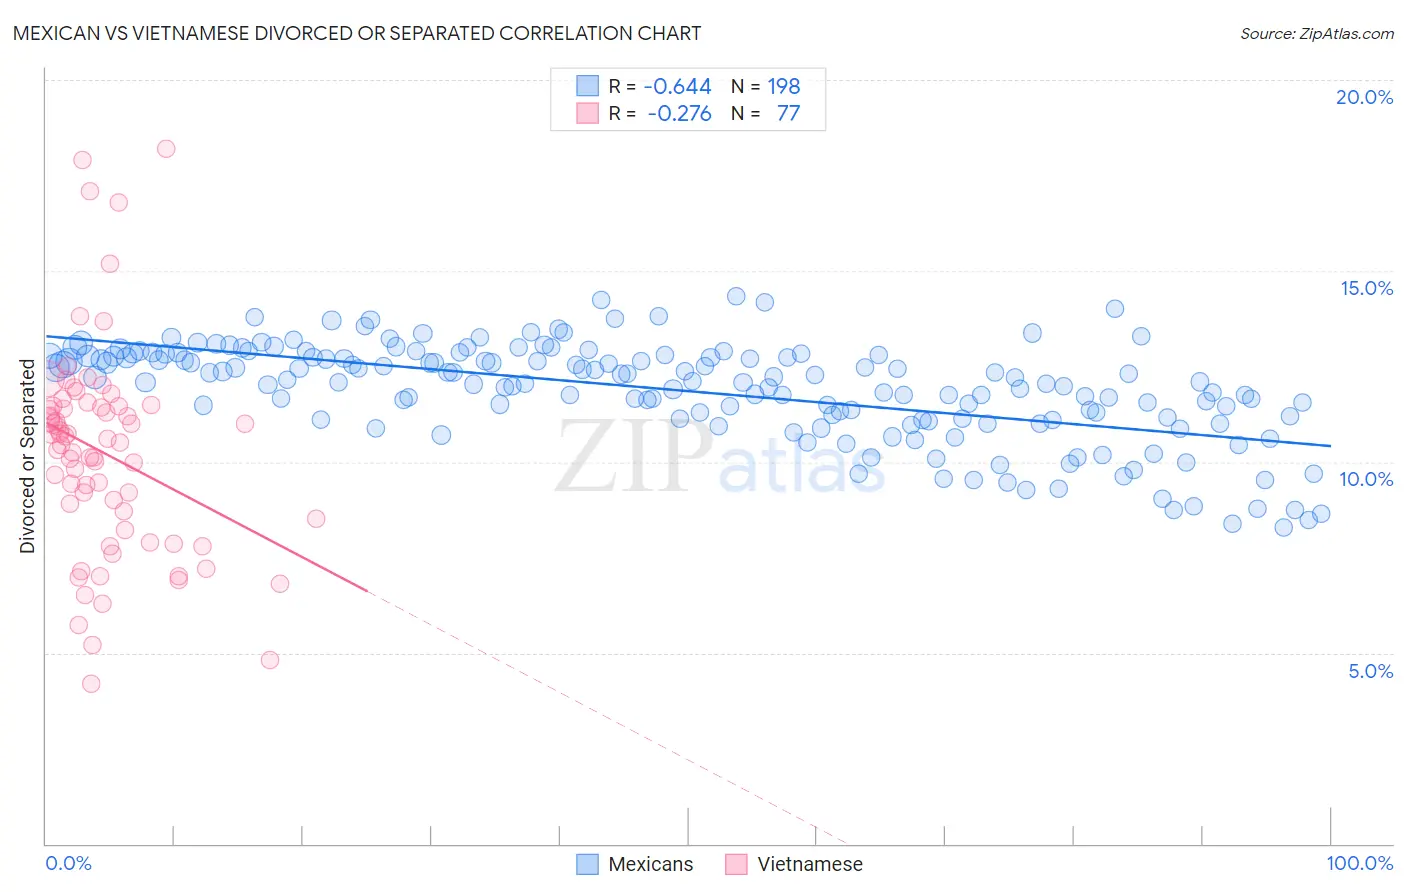
Mexican vs Vietnamese Divorced or Separated Correlation Chart
The statistical analysis conducted on geographies consisting of 564,740,181 people shows a significant negative correlation between the proportion of Mexicans and percentage of population currently divorced or separated in the United States with a correlation coefficient (R) of -0.644 and weighted average of 12.2%. Similarly, the statistical analysis conducted on geographies consisting of 170,663,276 people shows a weak negative correlation between the proportion of Vietnamese and percentage of population currently divorced or separated in the United States with a correlation coefficient (R) of -0.276 and weighted average of 10.8%, a difference of 13.3%.
Divorced or Separated Correlation Summary
| Measurement | Mexican | Vietnamese |
| Minimum | 8.3% | 4.2% |
| Maximum | 14.3% | 18.2% |
| Range | 6.1% | 14.0% |
| Mean | 11.9% | 10.2% |
| Median | 12.1% | 10.5% |
| Interquartile 25% (IQ1) | 11.1% | 8.3% |
| Interquartile 75% (IQ3) | 12.8% | 11.5% |
| Interquartile Range (IQR) | 1.6% | 3.1% |
| Standard Deviation (Sample) | 1.3% | 2.7% |
| Standard Deviation (Population) | 1.3% | 2.7% |
Similar Demographics by Divorced or Separated
Demographics Similar to Mexicans by Divorced or Separated
In terms of divorced or separated, the demographic groups most similar to Mexicans are Slovak (12.2%, a difference of 0.0%), Immigrants from Costa Rica (12.2%, a difference of 0.010%), Kenyan (12.2%, a difference of 0.040%), Immigrants from Guatemala (12.2%, a difference of 0.11%), and Immigrants from Ghana (12.2%, a difference of 0.12%).
| Demographics | Rating | Rank | Divorced or Separated |
| South Americans | 28.6 /100 | #200 | Fair 12.2% |
| Guatemalans | 26.9 /100 | #201 | Fair 12.2% |
| Portuguese | 23.5 /100 | #202 | Fair 12.2% |
| Immigrants | Guatemala | 23.2 /100 | #203 | Fair 12.2% |
| Kenyans | 21.8 /100 | #204 | Fair 12.2% |
| Immigrants | Costa Rica | 21.3 /100 | #205 | Fair 12.2% |
| Slovaks | 21.0 /100 | #206 | Fair 12.2% |
| Mexicans | 21.0 /100 | #207 | Fair 12.2% |
| Immigrants | Ghana | 18.8 /100 | #208 | Poor 12.2% |
| Immigrants | Trinidad and Tobago | 17.8 /100 | #209 | Poor 12.2% |
| Slavs | 17.0 /100 | #210 | Poor 12.2% |
| Trinidadians and Tobagonians | 16.6 /100 | #211 | Poor 12.2% |
| Immigrants | Kenya | 16.5 /100 | #212 | Poor 12.2% |
| Immigrants | Eastern Africa | 16.2 /100 | #213 | Poor 12.2% |
| Immigrants | Argentina | 15.5 /100 | #214 | Poor 12.2% |
Demographics Similar to Vietnamese by Divorced or Separated
In terms of divorced or separated, the demographic groups most similar to Vietnamese are Immigrants from Pakistan (10.8%, a difference of 0.18%), Immigrants from Asia (10.7%, a difference of 0.26%), Immigrants from Sri Lanka (10.8%, a difference of 0.37%), Iranian (10.8%, a difference of 0.42%), and Burmese (10.7%, a difference of 0.44%).
| Demographics | Rating | Rank | Divorced or Separated |
| Immigrants | Armenia | 100.0 /100 | #15 | Exceptional 10.6% |
| Immigrants | Korea | 100.0 /100 | #16 | Exceptional 10.6% |
| Immigrants | Israel | 100.0 /100 | #17 | Exceptional 10.6% |
| Immigrants | Iran | 100.0 /100 | #18 | Exceptional 10.6% |
| Asians | 100.0 /100 | #19 | Exceptional 10.6% |
| Burmese | 100.0 /100 | #20 | Exceptional 10.7% |
| Immigrants | Asia | 100.0 /100 | #21 | Exceptional 10.7% |
| Vietnamese | 100.0 /100 | #22 | Exceptional 10.8% |
| Immigrants | Pakistan | 100.0 /100 | #23 | Exceptional 10.8% |
| Immigrants | Sri Lanka | 100.0 /100 | #24 | Exceptional 10.8% |
| Iranians | 100.0 /100 | #25 | Exceptional 10.8% |
| Immigrants | Indonesia | 100.0 /100 | #26 | Exceptional 10.9% |
| Immigrants | Bangladesh | 100.0 /100 | #27 | Exceptional 11.0% |
| Immigrants | Malaysia | 100.0 /100 | #28 | Exceptional 11.0% |
| Armenians | 100.0 /100 | #29 | Exceptional 11.0% |