Immigrants from Taiwan vs Vietnamese Divorced or Separated
COMPARE
Immigrants from Taiwan
Vietnamese
Divorced or Separated
Divorced or Separated Comparison
Immigrants from Taiwan
Vietnamese
9.8%
DIVORCED OR SEPARATED
100.0/ 100
METRIC RATING
1st/ 347
METRIC RANK
10.8%
DIVORCED OR SEPARATED
100.0/ 100
METRIC RATING
22nd/ 347
METRIC RANK
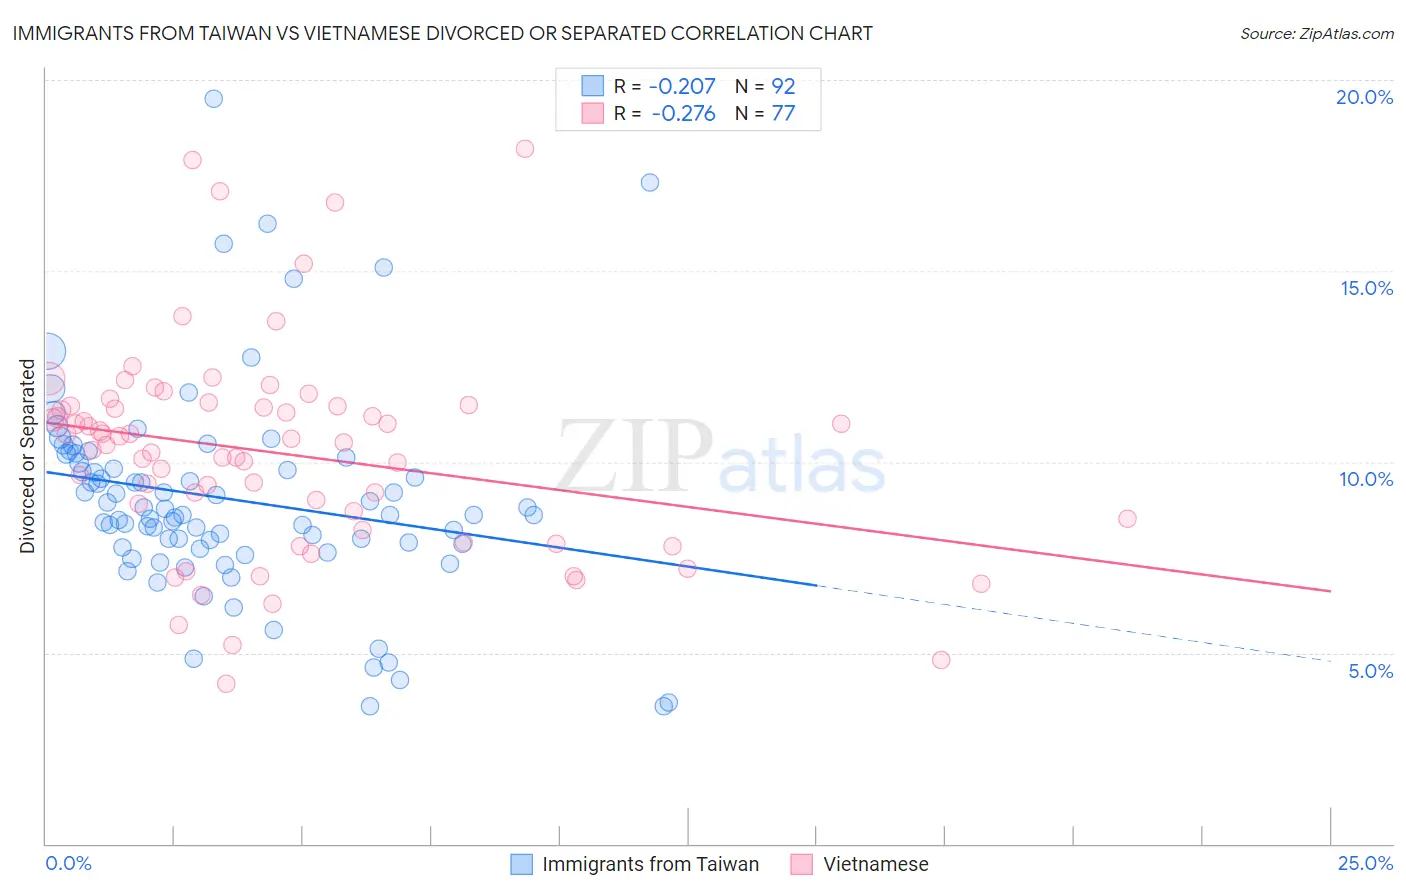
Immigrants from Taiwan vs Vietnamese Divorced or Separated Correlation Chart
The statistical analysis conducted on geographies consisting of 298,143,360 people shows a weak negative correlation between the proportion of Immigrants from Taiwan and percentage of population currently divorced or separated in the United States with a correlation coefficient (R) of -0.207 and weighted average of 9.8%. Similarly, the statistical analysis conducted on geographies consisting of 170,663,276 people shows a weak negative correlation between the proportion of Vietnamese and percentage of population currently divorced or separated in the United States with a correlation coefficient (R) of -0.276 and weighted average of 10.8%, a difference of 9.7%.
Divorced or Separated Correlation Summary
| Measurement | Immigrants from Taiwan | Vietnamese |
| Minimum | 3.6% | 4.2% |
| Maximum | 19.5% | 18.2% |
| Range | 15.9% | 14.0% |
| Mean | 9.0% | 10.2% |
| Median | 8.6% | 10.5% |
| Interquartile 25% (IQ1) | 7.8% | 8.3% |
| Interquartile 75% (IQ3) | 10.0% | 11.5% |
| Interquartile Range (IQR) | 2.2% | 3.1% |
| Standard Deviation (Sample) | 2.7% | 2.7% |
| Standard Deviation (Population) | 2.7% | 2.7% |
Similar Demographics by Divorced or Separated
Demographics Similar to Immigrants from Taiwan by Divorced or Separated
In terms of divorced or separated, the demographic groups most similar to Immigrants from Taiwan are Filipino (9.9%, a difference of 1.1%), Immigrants from Hong Kong (10.0%, a difference of 1.6%), Immigrants from China (10.0%, a difference of 2.4%), Immigrants from India (10.1%, a difference of 2.6%), and Indian (Asian) (10.2%, a difference of 4.0%).
| Demographics | Rating | Rank | Divorced or Separated |
| Immigrants | Taiwan | 100.0 /100 | #1 | Exceptional 9.8% |
| Filipinos | 100.0 /100 | #2 | Exceptional 9.9% |
| Immigrants | Hong Kong | 100.0 /100 | #3 | Exceptional 10.0% |
| Immigrants | China | 100.0 /100 | #4 | Exceptional 10.0% |
| Immigrants | India | 100.0 /100 | #5 | Exceptional 10.1% |
| Indians (Asian) | 100.0 /100 | #6 | Exceptional 10.2% |
| Thais | 100.0 /100 | #7 | Exceptional 10.2% |
| Immigrants | Eastern Asia | 100.0 /100 | #8 | Exceptional 10.2% |
| Yup'ik | 100.0 /100 | #9 | Exceptional 10.3% |
| Immigrants | Singapore | 100.0 /100 | #10 | Exceptional 10.3% |
| Immigrants | South Central Asia | 100.0 /100 | #11 | Exceptional 10.4% |
| Okinawans | 100.0 /100 | #12 | Exceptional 10.5% |
| Cypriots | 100.0 /100 | #13 | Exceptional 10.5% |
| Assyrians/Chaldeans/Syriacs | 100.0 /100 | #14 | Exceptional 10.6% |
| Immigrants | Armenia | 100.0 /100 | #15 | Exceptional 10.6% |
Demographics Similar to Vietnamese by Divorced or Separated
In terms of divorced or separated, the demographic groups most similar to Vietnamese are Immigrants from Pakistan (10.8%, a difference of 0.18%), Immigrants from Asia (10.7%, a difference of 0.26%), Immigrants from Sri Lanka (10.8%, a difference of 0.37%), Iranian (10.8%, a difference of 0.42%), and Burmese (10.7%, a difference of 0.44%).
| Demographics | Rating | Rank | Divorced or Separated |
| Immigrants | Armenia | 100.0 /100 | #15 | Exceptional 10.6% |
| Immigrants | Korea | 100.0 /100 | #16 | Exceptional 10.6% |
| Immigrants | Israel | 100.0 /100 | #17 | Exceptional 10.6% |
| Immigrants | Iran | 100.0 /100 | #18 | Exceptional 10.6% |
| Asians | 100.0 /100 | #19 | Exceptional 10.6% |
| Burmese | 100.0 /100 | #20 | Exceptional 10.7% |
| Immigrants | Asia | 100.0 /100 | #21 | Exceptional 10.7% |
| Vietnamese | 100.0 /100 | #22 | Exceptional 10.8% |
| Immigrants | Pakistan | 100.0 /100 | #23 | Exceptional 10.8% |
| Immigrants | Sri Lanka | 100.0 /100 | #24 | Exceptional 10.8% |
| Iranians | 100.0 /100 | #25 | Exceptional 10.8% |
| Immigrants | Indonesia | 100.0 /100 | #26 | Exceptional 10.9% |
| Immigrants | Bangladesh | 100.0 /100 | #27 | Exceptional 11.0% |
| Immigrants | Malaysia | 100.0 /100 | #28 | Exceptional 11.0% |
| Armenians | 100.0 /100 | #29 | Exceptional 11.0% |