Spanish vs Israeli Single Father Households
COMPARE
Spanish
Israeli
Single Father Households
Single Father Households Comparison
Spanish
Israelis
2.5%
SINGLE FATHER HOUSEHOLDS
1.1/ 100
METRIC RATING
258th/ 347
METRIC RANK
2.0%
SINGLE FATHER HOUSEHOLDS
100.0/ 100
METRIC RATING
31st/ 347
METRIC RANK
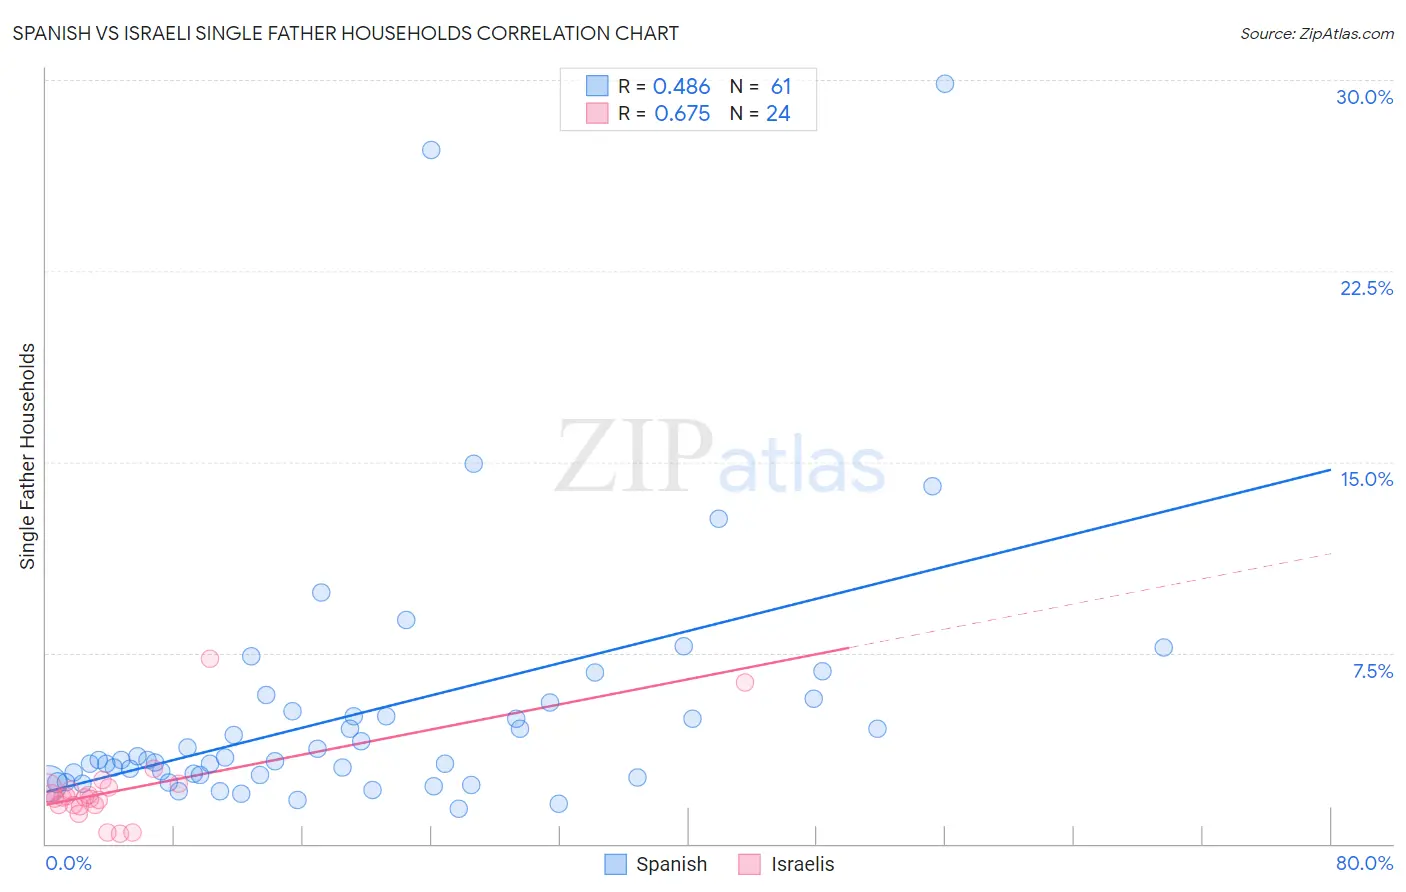
Spanish vs Israeli Single Father Households Correlation Chart
The statistical analysis conducted on geographies consisting of 418,035,178 people shows a moderate positive correlation between the proportion of Spanish and percentage of single father households in the United States with a correlation coefficient (R) of 0.486 and weighted average of 2.5%. Similarly, the statistical analysis conducted on geographies consisting of 209,705,406 people shows a significant positive correlation between the proportion of Israelis and percentage of single father households in the United States with a correlation coefficient (R) of 0.675 and weighted average of 2.0%, a difference of 28.3%.
Single Father Households Correlation Summary
| Measurement | Spanish | Israeli |
| Minimum | 1.4% | 0.39% |
| Maximum | 29.9% | 7.2% |
| Range | 28.5% | 6.9% |
| Mean | 5.2% | 2.1% |
| Median | 3.3% | 1.8% |
| Interquartile 25% (IQ1) | 2.6% | 1.5% |
| Interquartile 75% (IQ3) | 5.4% | 2.2% |
| Interquartile Range (IQR) | 2.7% | 0.68% |
| Standard Deviation (Sample) | 5.2% | 1.6% |
| Standard Deviation (Population) | 5.2% | 1.5% |
Similar Demographics by Single Father Households
Demographics Similar to Spanish by Single Father Households
In terms of single father households, the demographic groups most similar to Spanish are Immigrants from Congo (2.5%, a difference of 0.090%), Comanche (2.5%, a difference of 0.16%), Immigrants from Caribbean (2.5%, a difference of 0.24%), Potawatomi (2.5%, a difference of 0.37%), and Immigrants from Belize (2.5%, a difference of 0.40%).
| Demographics | Rating | Rank | Single Father Households |
| Liberians | 2.0 /100 | #251 | Tragic 2.5% |
| Immigrants | Eritrea | 2.0 /100 | #252 | Tragic 2.5% |
| Immigrants | Somalia | 1.9 /100 | #253 | Tragic 2.5% |
| Immigrants | Thailand | 1.8 /100 | #254 | Tragic 2.5% |
| Tongans | 1.5 /100 | #255 | Tragic 2.5% |
| Potawatomi | 1.4 /100 | #256 | Tragic 2.5% |
| Immigrants | Congo | 1.2 /100 | #257 | Tragic 2.5% |
| Spanish | 1.1 /100 | #258 | Tragic 2.5% |
| Comanche | 1.0 /100 | #259 | Tragic 2.5% |
| Immigrants | Caribbean | 1.0 /100 | #260 | Tragic 2.5% |
| Immigrants | Belize | 0.9 /100 | #261 | Tragic 2.5% |
| Immigrants | Liberia | 0.8 /100 | #262 | Tragic 2.5% |
| Dominicans | 0.8 /100 | #263 | Tragic 2.5% |
| Indonesians | 0.5 /100 | #264 | Tragic 2.6% |
| Immigrants | Micronesia | 0.5 /100 | #265 | Tragic 2.6% |
Demographics Similar to Israelis by Single Father Households
In terms of single father households, the demographic groups most similar to Israelis are Cambodian (2.0%, a difference of 0.030%), Chinese (2.0%, a difference of 0.040%), Bulgarian (2.0%, a difference of 0.050%), Immigrants from Japan (2.0%, a difference of 0.14%), and Turkish (2.0%, a difference of 0.25%).
| Demographics | Rating | Rank | Single Father Households |
| Immigrants | Russia | 100.0 /100 | #24 | Exceptional 2.0% |
| Eastern Europeans | 100.0 /100 | #25 | Exceptional 2.0% |
| Assyrians/Chaldeans/Syriacs | 100.0 /100 | #26 | Exceptional 2.0% |
| Immigrants | South Central Asia | 100.0 /100 | #27 | Exceptional 2.0% |
| Immigrants | Japan | 100.0 /100 | #28 | Exceptional 2.0% |
| Bulgarians | 100.0 /100 | #29 | Exceptional 2.0% |
| Cambodians | 100.0 /100 | #30 | Exceptional 2.0% |
| Israelis | 100.0 /100 | #31 | Exceptional 2.0% |
| Chinese | 100.0 /100 | #32 | Exceptional 2.0% |
| Turks | 100.0 /100 | #33 | Exceptional 2.0% |
| Immigrants | Australia | 100.0 /100 | #34 | Exceptional 2.0% |
| Albanians | 100.0 /100 | #35 | Exceptional 2.0% |
| Immigrants | Belgium | 100.0 /100 | #36 | Exceptional 2.0% |
| Immigrants | St. Vincent and the Grenadines | 100.0 /100 | #37 | Exceptional 2.0% |
| Immigrants | Eastern Europe | 100.0 /100 | #38 | Exceptional 2.0% |