Spanish vs Czech Single Father Households
COMPARE
Spanish
Czech
Single Father Households
Single Father Households Comparison
Spanish
Czechs
2.5%
SINGLE FATHER HOUSEHOLDS
1.1/ 100
METRIC RATING
258th/ 347
METRIC RANK
2.3%
SINGLE FATHER HOUSEHOLDS
62.5/ 100
METRIC RATING
169th/ 347
METRIC RANK
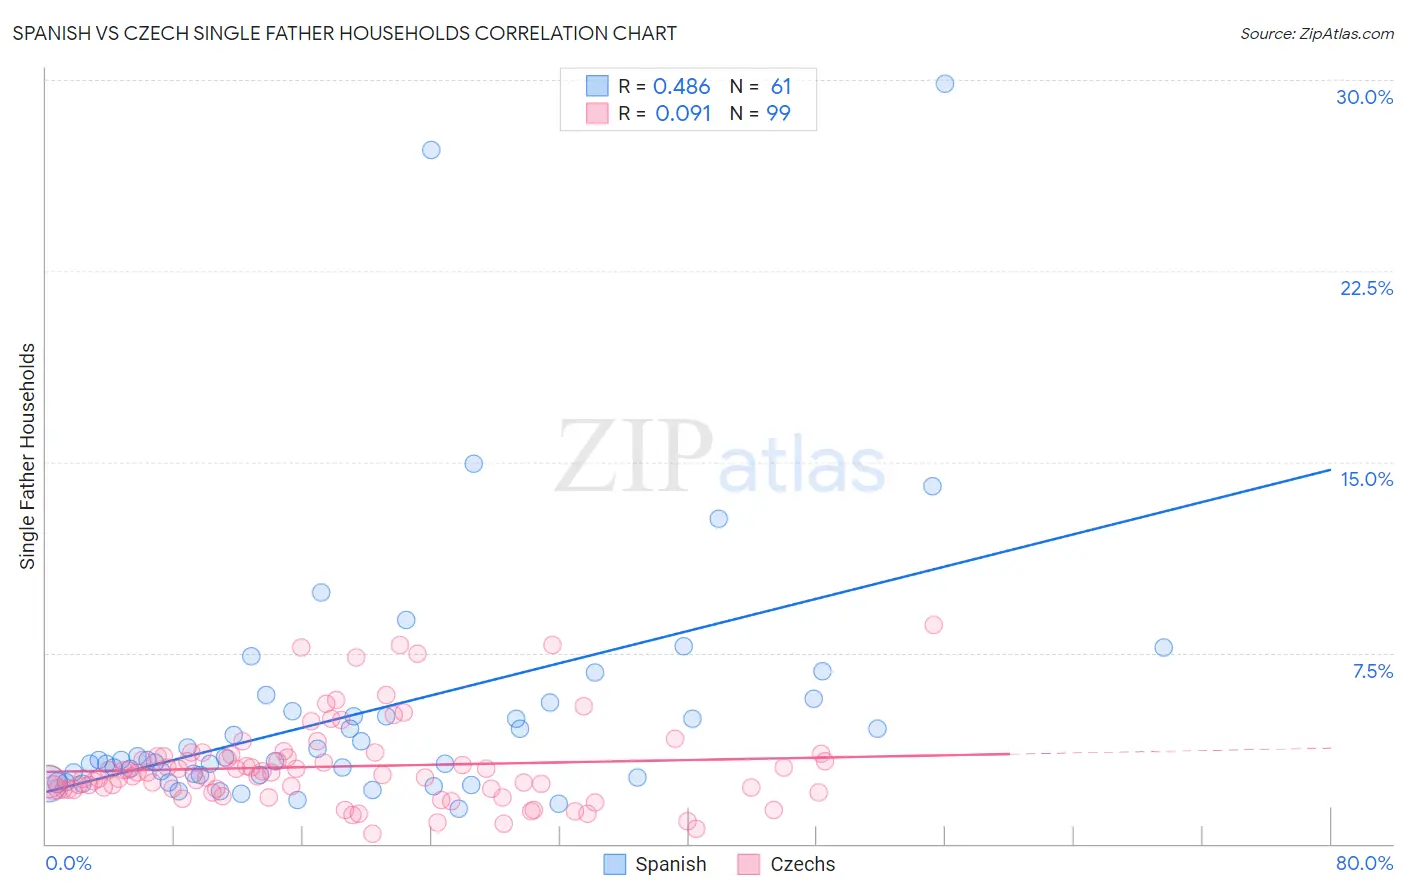
Spanish vs Czech Single Father Households Correlation Chart
The statistical analysis conducted on geographies consisting of 418,035,178 people shows a moderate positive correlation between the proportion of Spanish and percentage of single father households in the United States with a correlation coefficient (R) of 0.486 and weighted average of 2.5%. Similarly, the statistical analysis conducted on geographies consisting of 477,253,750 people shows a slight positive correlation between the proportion of Czechs and percentage of single father households in the United States with a correlation coefficient (R) of 0.091 and weighted average of 2.3%, a difference of 9.2%.
Single Father Households Correlation Summary
| Measurement | Spanish | Czech |
| Minimum | 1.4% | 0.41% |
| Maximum | 29.9% | 8.6% |
| Range | 28.5% | 8.2% |
| Mean | 5.2% | 3.0% |
| Median | 3.3% | 2.7% |
| Interquartile 25% (IQ1) | 2.6% | 2.1% |
| Interquartile 75% (IQ3) | 5.4% | 3.4% |
| Interquartile Range (IQR) | 2.7% | 1.3% |
| Standard Deviation (Sample) | 5.2% | 1.7% |
| Standard Deviation (Population) | 5.2% | 1.6% |
Similar Demographics by Single Father Households
Demographics Similar to Spanish by Single Father Households
In terms of single father households, the demographic groups most similar to Spanish are Immigrants from Congo (2.5%, a difference of 0.090%), Comanche (2.5%, a difference of 0.16%), Immigrants from Caribbean (2.5%, a difference of 0.24%), Potawatomi (2.5%, a difference of 0.37%), and Immigrants from Belize (2.5%, a difference of 0.40%).
| Demographics | Rating | Rank | Single Father Households |
| Liberians | 2.0 /100 | #251 | Tragic 2.5% |
| Immigrants | Eritrea | 2.0 /100 | #252 | Tragic 2.5% |
| Immigrants | Somalia | 1.9 /100 | #253 | Tragic 2.5% |
| Immigrants | Thailand | 1.8 /100 | #254 | Tragic 2.5% |
| Tongans | 1.5 /100 | #255 | Tragic 2.5% |
| Potawatomi | 1.4 /100 | #256 | Tragic 2.5% |
| Immigrants | Congo | 1.2 /100 | #257 | Tragic 2.5% |
| Spanish | 1.1 /100 | #258 | Tragic 2.5% |
| Comanche | 1.0 /100 | #259 | Tragic 2.5% |
| Immigrants | Caribbean | 1.0 /100 | #260 | Tragic 2.5% |
| Immigrants | Belize | 0.9 /100 | #261 | Tragic 2.5% |
| Immigrants | Liberia | 0.8 /100 | #262 | Tragic 2.5% |
| Dominicans | 0.8 /100 | #263 | Tragic 2.5% |
| Indonesians | 0.5 /100 | #264 | Tragic 2.6% |
| Immigrants | Micronesia | 0.5 /100 | #265 | Tragic 2.6% |
Demographics Similar to Czechs by Single Father Households
In terms of single father households, the demographic groups most similar to Czechs are Ugandan (2.3%, a difference of 0.020%), Icelander (2.3%, a difference of 0.040%), Swedish (2.3%, a difference of 0.070%), South American (2.3%, a difference of 0.14%), and Czechoslovakian (2.3%, a difference of 0.29%).
| Demographics | Rating | Rank | Single Father Households |
| Scottish | 72.8 /100 | #162 | Good 2.3% |
| Irish | 72.1 /100 | #163 | Good 2.3% |
| Pakistanis | 70.6 /100 | #164 | Good 2.3% |
| Scotch-Irish | 69.4 /100 | #165 | Good 2.3% |
| English | 68.6 /100 | #166 | Good 2.3% |
| South Americans | 64.3 /100 | #167 | Good 2.3% |
| Icelanders | 63.1 /100 | #168 | Good 2.3% |
| Czechs | 62.5 /100 | #169 | Good 2.3% |
| Ugandans | 62.2 /100 | #170 | Good 2.3% |
| Swedes | 61.6 /100 | #171 | Good 2.3% |
| Czechoslovakians | 58.9 /100 | #172 | Average 2.3% |
| Celtics | 55.4 /100 | #173 | Average 2.3% |
| Afghans | 50.0 /100 | #174 | Average 2.3% |
| Immigrants | Jamaica | 49.1 /100 | #175 | Average 2.3% |
| Danes | 48.2 /100 | #176 | Average 2.3% |