Belgian vs Immigrants from Belarus Single Father Households
COMPARE
Belgian
Immigrants from Belarus
Single Father Households
Single Father Households Comparison
Belgians
Immigrants from Belarus
2.3%
SINGLE FATHER HOUSEHOLDS
43.3/ 100
METRIC RATING
182nd/ 347
METRIC RANK
1.9%
SINGLE FATHER HOUSEHOLDS
100.0/ 100
METRIC RATING
11th/ 347
METRIC RANK
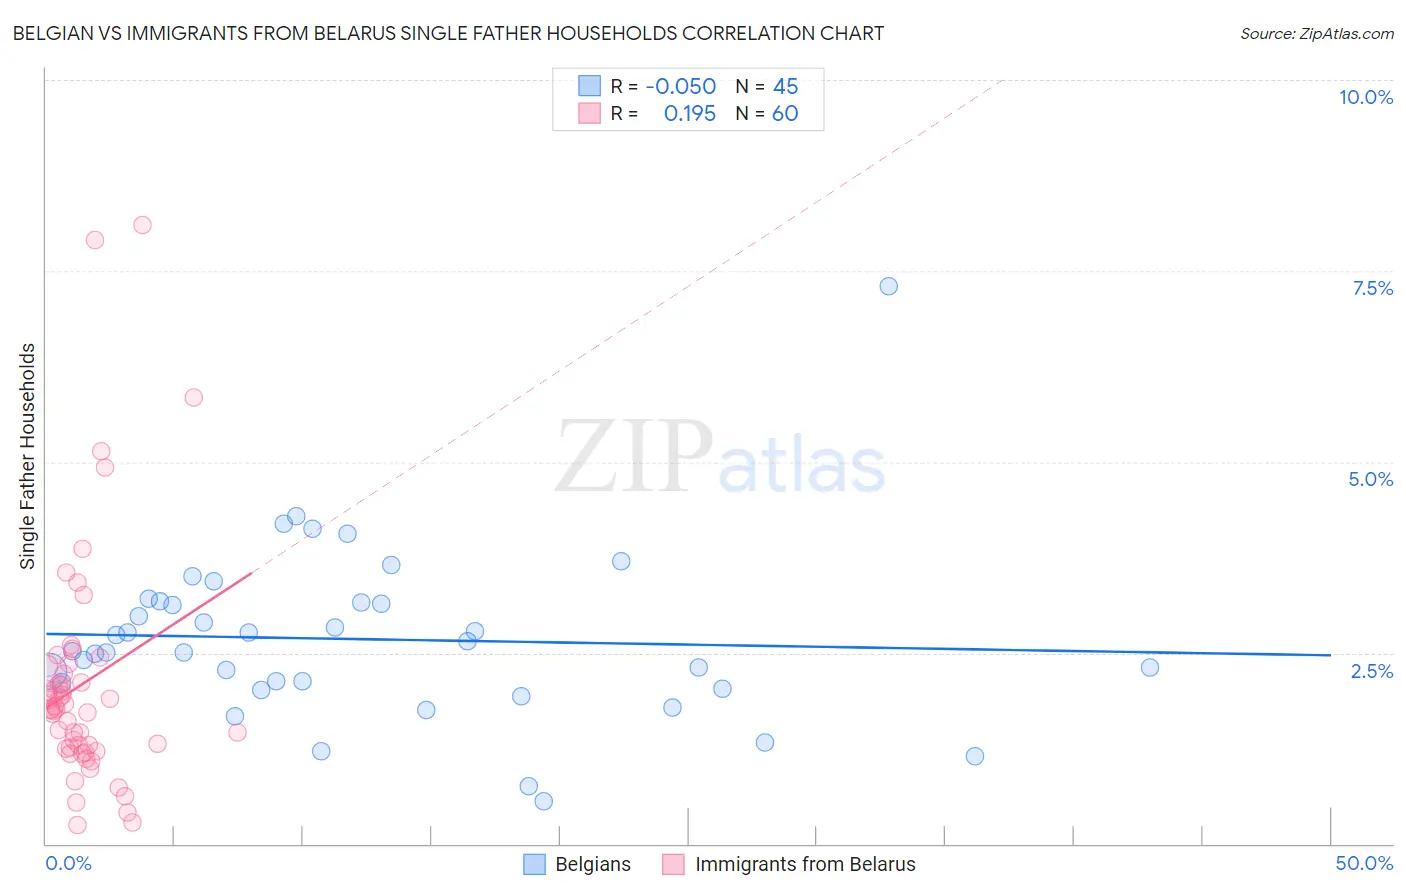
Belgian vs Immigrants from Belarus Single Father Households Correlation Chart
The statistical analysis conducted on geographies consisting of 352,865,149 people shows a slight negative correlation between the proportion of Belgians and percentage of single father households in the United States with a correlation coefficient (R) of -0.050 and weighted average of 2.3%. Similarly, the statistical analysis conducted on geographies consisting of 149,894,019 people shows a poor positive correlation between the proportion of Immigrants from Belarus and percentage of single father households in the United States with a correlation coefficient (R) of 0.195 and weighted average of 1.9%, a difference of 26.4%.
Single Father Households Correlation Summary
| Measurement | Belgian | Immigrants from Belarus |
| Minimum | 0.55% | 0.25% |
| Maximum | 7.3% | 8.1% |
| Range | 6.8% | 7.9% |
| Mean | 2.7% | 2.1% |
| Median | 2.5% | 1.8% |
| Interquartile 25% (IQ1) | 2.1% | 1.2% |
| Interquartile 75% (IQ3) | 3.2% | 2.3% |
| Interquartile Range (IQR) | 1.1% | 1.0% |
| Standard Deviation (Sample) | 1.1% | 1.5% |
| Standard Deviation (Population) | 1.1% | 1.5% |
Similar Demographics by Single Father Households
Demographics Similar to Belgians by Single Father Households
In terms of single father households, the demographic groups most similar to Belgians are Jamaican (2.3%, a difference of 0.020%), Yugoslavian (2.3%, a difference of 0.040%), Costa Rican (2.3%, a difference of 0.060%), Welsh (2.3%, a difference of 0.060%), and Immigrants from Panama (2.4%, a difference of 0.11%).
| Demographics | Rating | Rank | Single Father Households |
| Immigrants | Jamaica | 49.1 /100 | #175 | Average 2.3% |
| Danes | 48.2 /100 | #176 | Average 2.3% |
| Colombians | 48.0 /100 | #177 | Average 2.3% |
| Costa Ricans | 44.1 /100 | #178 | Average 2.3% |
| Welsh | 44.0 /100 | #179 | Average 2.3% |
| Yugoslavians | 43.9 /100 | #180 | Average 2.3% |
| Jamaicans | 43.5 /100 | #181 | Average 2.3% |
| Belgians | 43.3 /100 | #182 | Average 2.3% |
| Immigrants | Panama | 41.8 /100 | #183 | Average 2.4% |
| Sri Lankans | 41.8 /100 | #184 | Average 2.4% |
| Nigerians | 41.0 /100 | #185 | Average 2.4% |
| Immigrants | Bosnia and Herzegovina | 40.4 /100 | #186 | Average 2.4% |
| Immigrants | Colombia | 34.0 /100 | #187 | Fair 2.4% |
| Hmong | 33.0 /100 | #188 | Fair 2.4% |
| U.S. Virgin Islanders | 31.8 /100 | #189 | Fair 2.4% |
Demographics Similar to Immigrants from Belarus by Single Father Households
In terms of single father households, the demographic groups most similar to Immigrants from Belarus are Okinawan (1.9%, a difference of 0.32%), Immigrants from Greece (1.9%, a difference of 0.44%), Immigrants from Singapore (1.9%, a difference of 0.47%), Immigrants from China (1.8%, a difference of 0.68%), and Immigrants from Ireland (1.8%, a difference of 0.82%).
| Demographics | Rating | Rank | Single Father Households |
| Immigrants | Uzbekistan | 100.0 /100 | #4 | Exceptional 1.8% |
| Immigrants | Hong Kong | 100.0 /100 | #5 | Exceptional 1.8% |
| Immigrants | Taiwan | 100.0 /100 | #6 | Exceptional 1.8% |
| Cypriots | 100.0 /100 | #7 | Exceptional 1.8% |
| Immigrants | Ireland | 100.0 /100 | #8 | Exceptional 1.8% |
| Immigrants | China | 100.0 /100 | #9 | Exceptional 1.8% |
| Okinawans | 100.0 /100 | #10 | Exceptional 1.9% |
| Immigrants | Belarus | 100.0 /100 | #11 | Exceptional 1.9% |
| Immigrants | Greece | 100.0 /100 | #12 | Exceptional 1.9% |
| Immigrants | Singapore | 100.0 /100 | #13 | Exceptional 1.9% |
| Immigrants | Lithuania | 100.0 /100 | #14 | Exceptional 1.9% |
| Immigrants | Eastern Asia | 100.0 /100 | #15 | Exceptional 1.9% |
| Immigrants | Iran | 100.0 /100 | #16 | Exceptional 1.9% |
| Immigrants | India | 100.0 /100 | #17 | Exceptional 1.9% |
| Indians (Asian) | 100.0 /100 | #18 | Exceptional 1.9% |