Austrian vs Colombian Divorced or Separated
COMPARE
Austrian
Colombian
Divorced or Separated
Divorced or Separated Comparison
Austrians
Colombians
12.0%
DIVORCED OR SEPARATED
72.2/ 100
METRIC RATING
153rd/ 347
METRIC RANK
12.4%
DIVORCED OR SEPARATED
4.2/ 100
METRIC RATING
236th/ 347
METRIC RANK
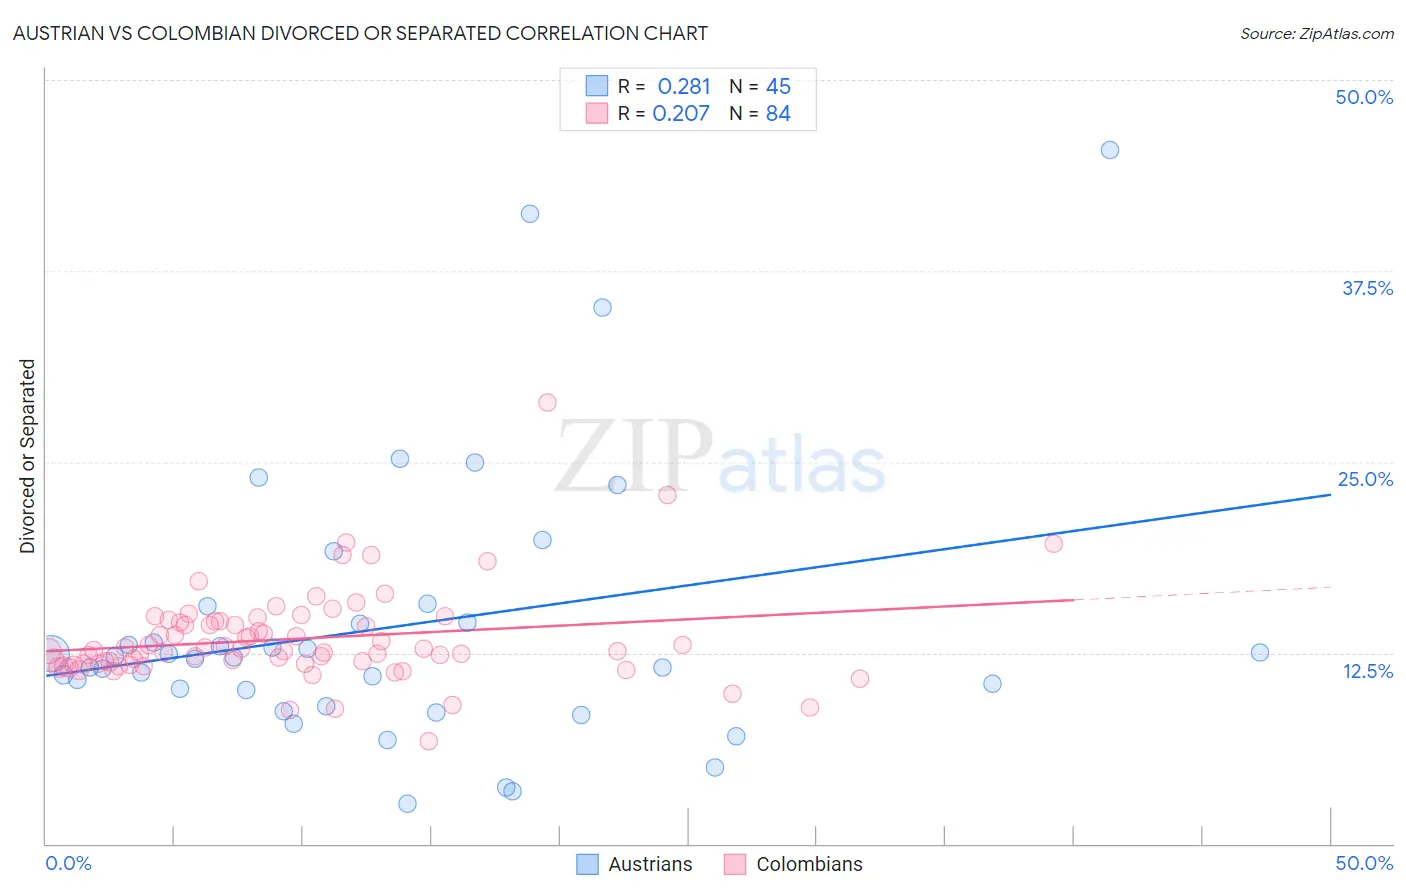
Austrian vs Colombian Divorced or Separated Correlation Chart
The statistical analysis conducted on geographies consisting of 451,875,003 people shows a weak positive correlation between the proportion of Austrians and percentage of population currently divorced or separated in the United States with a correlation coefficient (R) of 0.281 and weighted average of 12.0%. Similarly, the statistical analysis conducted on geographies consisting of 419,450,330 people shows a weak positive correlation between the proportion of Colombians and percentage of population currently divorced or separated in the United States with a correlation coefficient (R) of 0.207 and weighted average of 12.4%, a difference of 3.6%.
Divorced or Separated Correlation Summary
| Measurement | Austrian | Colombian |
| Minimum | 2.6% | 6.7% |
| Maximum | 45.4% | 28.9% |
| Range | 42.8% | 22.2% |
| Mean | 14.2% | 13.4% |
| Median | 12.2% | 12.6% |
| Interquartile 25% (IQ1) | 9.5% | 11.8% |
| Interquartile 75% (IQ3) | 15.0% | 14.5% |
| Interquartile Range (IQR) | 5.5% | 2.8% |
| Standard Deviation (Sample) | 8.9% | 3.1% |
| Standard Deviation (Population) | 8.8% | 3.1% |
Similar Demographics by Divorced or Separated
Demographics Similar to Austrians by Divorced or Separated
In terms of divorced or separated, the demographic groups most similar to Austrians are Chilean (12.0%, a difference of 0.040%), Japanese (12.0%, a difference of 0.060%), Immigrants from Hungary (11.9%, a difference of 0.070%), Hungarian (12.0%, a difference of 0.080%), and Immigrants from Brazil (12.0%, a difference of 0.14%).
| Demographics | Rating | Rank | Divorced or Separated |
| Immigrants | Grenada | 79.1 /100 | #146 | Good 11.9% |
| Poles | 78.6 /100 | #147 | Good 11.9% |
| Italians | 77.8 /100 | #148 | Good 11.9% |
| Immigrants | Oceania | 77.7 /100 | #149 | Good 11.9% |
| Immigrants | Portugal | 77.3 /100 | #150 | Good 11.9% |
| Czechs | 76.4 /100 | #151 | Good 11.9% |
| Immigrants | Hungary | 73.7 /100 | #152 | Good 11.9% |
| Austrians | 72.2 /100 | #153 | Good 12.0% |
| Chileans | 71.3 /100 | #154 | Good 12.0% |
| Japanese | 70.9 /100 | #155 | Good 12.0% |
| Hungarians | 70.3 /100 | #156 | Good 12.0% |
| Immigrants | Brazil | 68.8 /100 | #157 | Good 12.0% |
| Icelanders | 66.0 /100 | #158 | Good 12.0% |
| Immigrants | Barbados | 66.0 /100 | #159 | Good 12.0% |
| Immigrants | Scotland | 65.8 /100 | #160 | Good 12.0% |
Demographics Similar to Colombians by Divorced or Separated
In terms of divorced or separated, the demographic groups most similar to Colombians are Immigrants from Laos (12.4%, a difference of 0.0%), Immigrants from Bosnia and Herzegovina (12.4%, a difference of 0.030%), West Indian (12.4%, a difference of 0.040%), Sudanese (12.4%, a difference of 0.040%), and Immigrants from Germany (12.4%, a difference of 0.040%).
| Demographics | Rating | Rank | Divorced or Separated |
| Immigrants | Sudan | 8.2 /100 | #229 | Tragic 12.3% |
| Yakama | 7.8 /100 | #230 | Tragic 12.3% |
| Yugoslavians | 6.6 /100 | #231 | Tragic 12.3% |
| Canadians | 5.3 /100 | #232 | Tragic 12.4% |
| Malaysians | 4.8 /100 | #233 | Tragic 12.4% |
| West Indians | 4.4 /100 | #234 | Tragic 12.4% |
| Immigrants | Bosnia and Herzegovina | 4.3 /100 | #235 | Tragic 12.4% |
| Colombians | 4.2 /100 | #236 | Tragic 12.4% |
| Immigrants | Laos | 4.2 /100 | #237 | Tragic 12.4% |
| Sudanese | 4.0 /100 | #238 | Tragic 12.4% |
| Immigrants | Germany | 4.0 /100 | #239 | Tragic 12.4% |
| British West Indians | 3.7 /100 | #240 | Tragic 12.4% |
| Uruguayans | 3.4 /100 | #241 | Tragic 12.4% |
| Dutch | 3.1 /100 | #242 | Tragic 12.4% |
| Immigrants | Latin America | 2.8 /100 | #243 | Tragic 12.4% |