Spaniard vs Immigrants from Lithuania Married-couple Households
COMPARE
Spaniard
Immigrants from Lithuania
Married-couple Households
Married-couple Households Comparison
Spaniards
Immigrants from Lithuania
47.2%
MARRIED-COUPLE HOUSEHOLDS
84.1/ 100
METRIC RATING
142nd/ 347
METRIC RANK
48.6%
MARRIED-COUPLE HOUSEHOLDS
99.3/ 100
METRIC RATING
54th/ 347
METRIC RANK
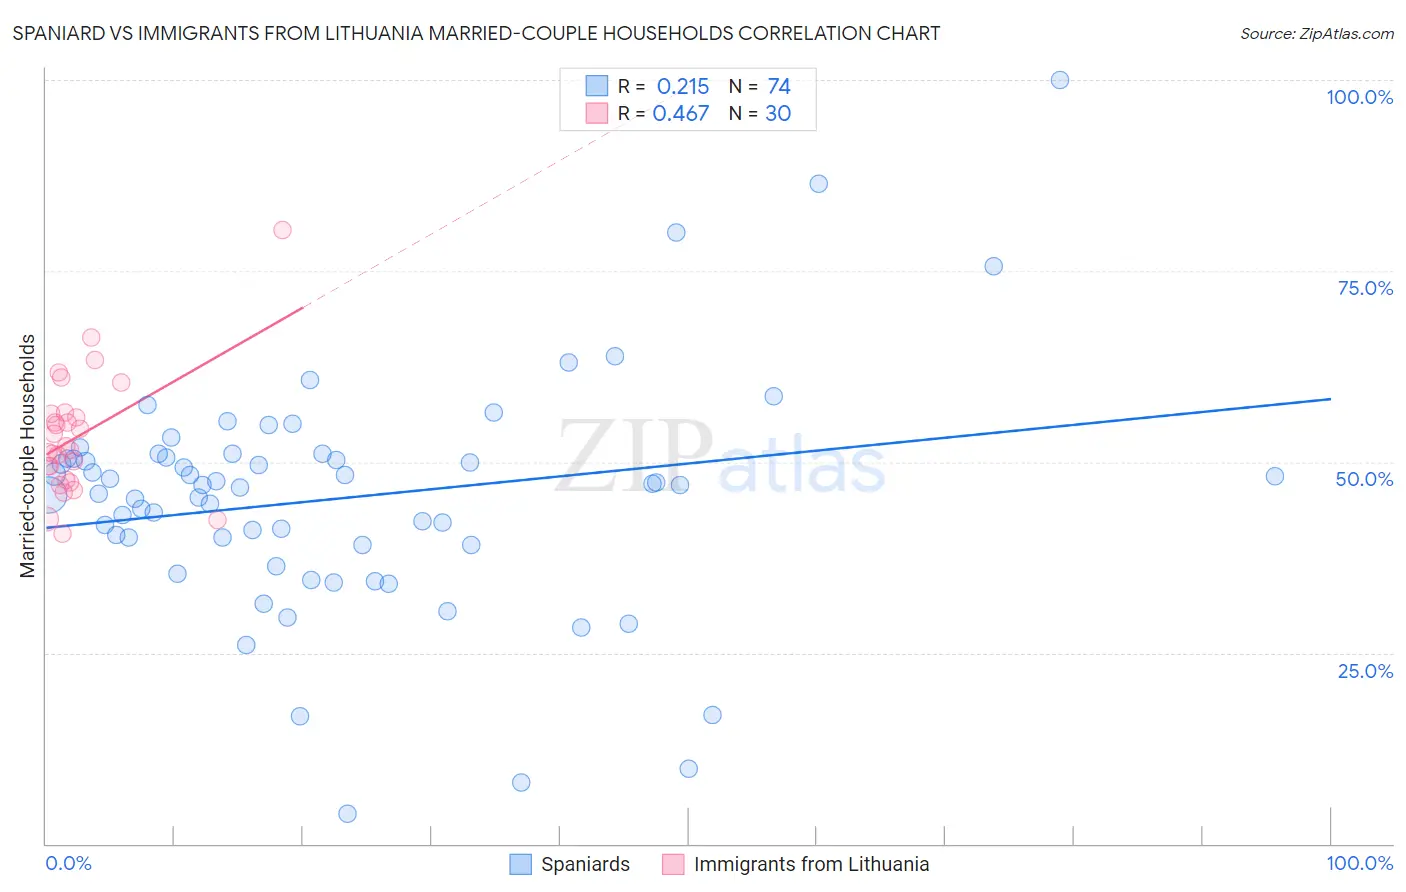
Spaniard vs Immigrants from Lithuania Married-couple Households Correlation Chart
The statistical analysis conducted on geographies consisting of 443,146,700 people shows a weak positive correlation between the proportion of Spaniards and percentage of married-couple family households in the United States with a correlation coefficient (R) of 0.215 and weighted average of 47.2%. Similarly, the statistical analysis conducted on geographies consisting of 117,713,976 people shows a moderate positive correlation between the proportion of Immigrants from Lithuania and percentage of married-couple family households in the United States with a correlation coefficient (R) of 0.467 and weighted average of 48.6%, a difference of 3.0%.
Married-couple Households Correlation Summary
| Measurement | Spaniard | Immigrants from Lithuania |
| Minimum | 4.0% | 40.7% |
| Maximum | 100.0% | 80.4% |
| Range | 96.0% | 39.7% |
| Mean | 45.3% | 53.3% |
| Median | 47.0% | 51.7% |
| Interquartile 25% (IQ1) | 39.1% | 47.6% |
| Interquartile 75% (IQ3) | 50.6% | 56.4% |
| Interquartile Range (IQR) | 11.4% | 8.7% |
| Standard Deviation (Sample) | 15.4% | 8.1% |
| Standard Deviation (Population) | 15.3% | 7.9% |
Similar Demographics by Married-couple Households
Demographics Similar to Spaniards by Married-couple Households
In terms of married-couple households, the demographic groups most similar to Spaniards are Spanish (47.2%, a difference of 0.020%), Costa Rican (47.2%, a difference of 0.020%), Immigrants from Belarus (47.2%, a difference of 0.020%), Immigrants from Sweden (47.2%, a difference of 0.040%), and Mexican (47.1%, a difference of 0.050%).
| Demographics | Rating | Rank | Married-couple Households |
| Immigrants | Argentina | 86.0 /100 | #135 | Excellent 47.2% |
| New Zealanders | 85.3 /100 | #136 | Excellent 47.2% |
| Immigrants | Malaysia | 85.2 /100 | #137 | Excellent 47.2% |
| Immigrants | Afghanistan | 85.1 /100 | #138 | Excellent 47.2% |
| Immigrants | Sweden | 84.7 /100 | #139 | Excellent 47.2% |
| Spanish | 84.5 /100 | #140 | Excellent 47.2% |
| Costa Ricans | 84.4 /100 | #141 | Excellent 47.2% |
| Spaniards | 84.1 /100 | #142 | Excellent 47.2% |
| Immigrants | Belarus | 83.8 /100 | #143 | Excellent 47.2% |
| Mexicans | 83.4 /100 | #144 | Excellent 47.1% |
| Slovenes | 81.7 /100 | #145 | Excellent 47.1% |
| Immigrants | Western Europe | 81.6 /100 | #146 | Excellent 47.1% |
| Immigrants | Syria | 81.6 /100 | #147 | Excellent 47.1% |
| Icelanders | 79.5 /100 | #148 | Good 47.0% |
| Paraguayans | 78.7 /100 | #149 | Good 47.0% |
Demographics Similar to Immigrants from Lithuania by Married-couple Households
In terms of married-couple households, the demographic groups most similar to Immigrants from Lithuania are White/Caucasian (48.6%, a difference of 0.010%), Austrian (48.6%, a difference of 0.010%), Immigrants from Northern Europe (48.6%, a difference of 0.010%), Irish (48.6%, a difference of 0.060%), and Eastern European (48.6%, a difference of 0.090%).
| Demographics | Rating | Rank | Married-couple Households |
| British | 99.5 /100 | #47 | Exceptional 48.7% |
| Indians (Asian) | 99.4 /100 | #48 | Exceptional 48.7% |
| Immigrants | Sri Lanka | 99.4 /100 | #49 | Exceptional 48.7% |
| Samoans | 99.4 /100 | #50 | Exceptional 48.7% |
| Eastern Europeans | 99.3 /100 | #51 | Exceptional 48.6% |
| Irish | 99.3 /100 | #52 | Exceptional 48.6% |
| Whites/Caucasians | 99.3 /100 | #53 | Exceptional 48.6% |
| Immigrants | Lithuania | 99.3 /100 | #54 | Exceptional 48.6% |
| Austrians | 99.3 /100 | #55 | Exceptional 48.6% |
| Immigrants | Northern Europe | 99.3 /100 | #56 | Exceptional 48.6% |
| Poles | 99.2 /100 | #57 | Exceptional 48.5% |
| Immigrants | Indonesia | 99.2 /100 | #58 | Exceptional 48.5% |
| Czechoslovakians | 99.2 /100 | #59 | Exceptional 48.5% |
| Croatians | 99.1 /100 | #60 | Exceptional 48.5% |
| Bulgarians | 99.1 /100 | #61 | Exceptional 48.5% |