Spaniard vs Immigrants from Ghana Married-couple Households
COMPARE
Spaniard
Immigrants from Ghana
Married-couple Households
Married-couple Households Comparison
Spaniards
Immigrants from Ghana
47.2%
MARRIED-COUPLE HOUSEHOLDS
84.1/ 100
METRIC RATING
142nd/ 347
METRIC RANK
41.8%
MARRIED-COUPLE HOUSEHOLDS
0.0/ 100
METRIC RATING
299th/ 347
METRIC RANK
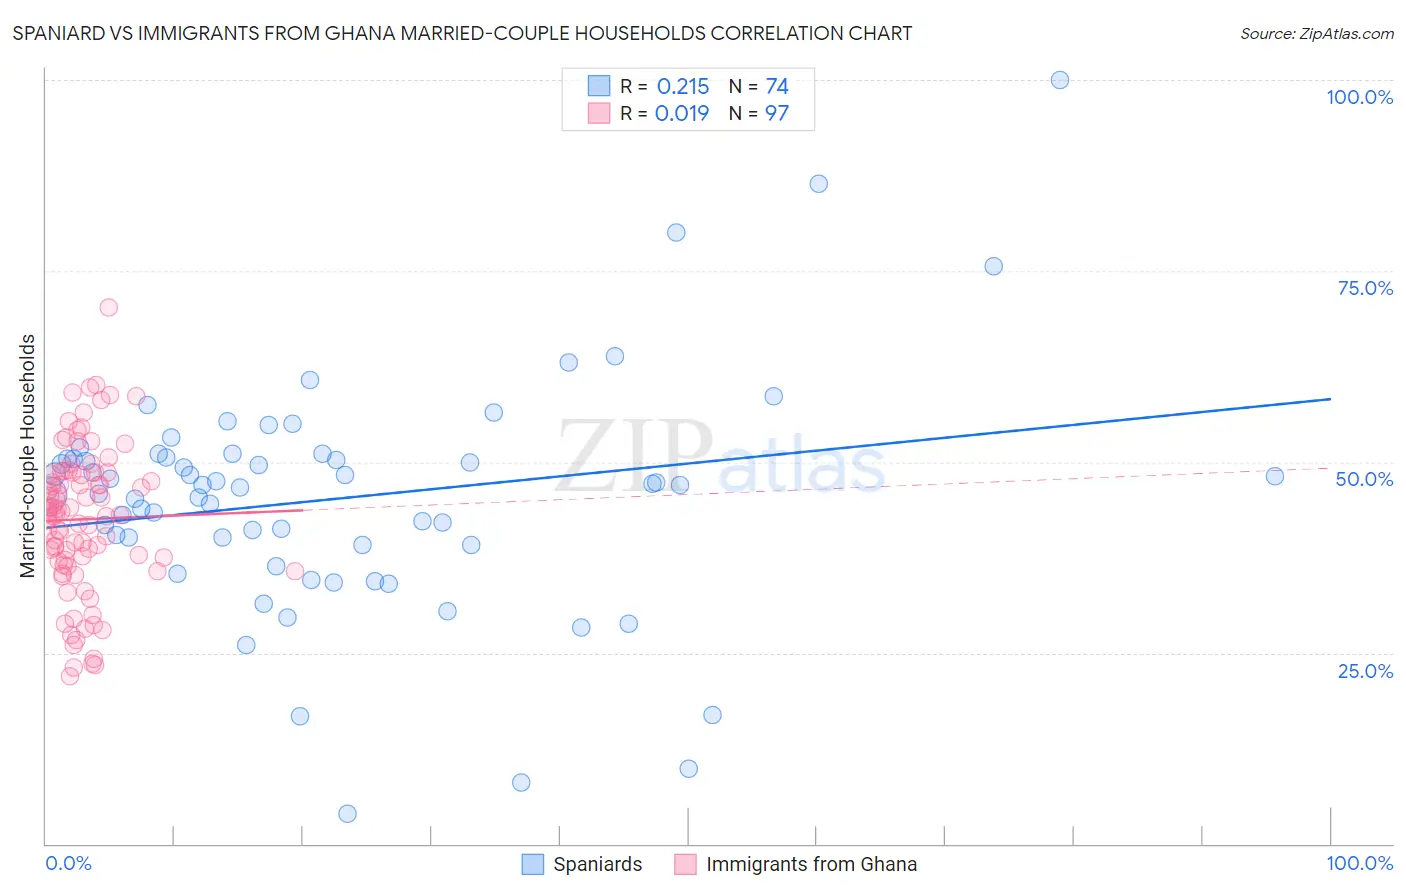
Spaniard vs Immigrants from Ghana Married-couple Households Correlation Chart
The statistical analysis conducted on geographies consisting of 443,146,700 people shows a weak positive correlation between the proportion of Spaniards and percentage of married-couple family households in the United States with a correlation coefficient (R) of 0.215 and weighted average of 47.2%. Similarly, the statistical analysis conducted on geographies consisting of 199,796,188 people shows no correlation between the proportion of Immigrants from Ghana and percentage of married-couple family households in the United States with a correlation coefficient (R) of 0.019 and weighted average of 41.8%, a difference of 12.9%.
Married-couple Households Correlation Summary
| Measurement | Spaniard | Immigrants from Ghana |
| Minimum | 4.0% | 22.0% |
| Maximum | 100.0% | 70.3% |
| Range | 96.0% | 48.3% |
| Mean | 45.3% | 42.5% |
| Median | 47.0% | 43.2% |
| Interquartile 25% (IQ1) | 39.1% | 36.8% |
| Interquartile 75% (IQ3) | 50.6% | 48.6% |
| Interquartile Range (IQR) | 11.4% | 11.8% |
| Standard Deviation (Sample) | 15.4% | 9.6% |
| Standard Deviation (Population) | 15.3% | 9.6% |
Similar Demographics by Married-couple Households
Demographics Similar to Spaniards by Married-couple Households
In terms of married-couple households, the demographic groups most similar to Spaniards are Spanish (47.2%, a difference of 0.020%), Costa Rican (47.2%, a difference of 0.020%), Immigrants from Belarus (47.2%, a difference of 0.020%), Immigrants from Sweden (47.2%, a difference of 0.040%), and Mexican (47.1%, a difference of 0.050%).
| Demographics | Rating | Rank | Married-couple Households |
| Immigrants | Argentina | 86.0 /100 | #135 | Excellent 47.2% |
| New Zealanders | 85.3 /100 | #136 | Excellent 47.2% |
| Immigrants | Malaysia | 85.2 /100 | #137 | Excellent 47.2% |
| Immigrants | Afghanistan | 85.1 /100 | #138 | Excellent 47.2% |
| Immigrants | Sweden | 84.7 /100 | #139 | Excellent 47.2% |
| Spanish | 84.5 /100 | #140 | Excellent 47.2% |
| Costa Ricans | 84.4 /100 | #141 | Excellent 47.2% |
| Spaniards | 84.1 /100 | #142 | Excellent 47.2% |
| Immigrants | Belarus | 83.8 /100 | #143 | Excellent 47.2% |
| Mexicans | 83.4 /100 | #144 | Excellent 47.1% |
| Slovenes | 81.7 /100 | #145 | Excellent 47.1% |
| Immigrants | Western Europe | 81.6 /100 | #146 | Excellent 47.1% |
| Immigrants | Syria | 81.6 /100 | #147 | Excellent 47.1% |
| Icelanders | 79.5 /100 | #148 | Good 47.0% |
| Paraguayans | 78.7 /100 | #149 | Good 47.0% |
Demographics Similar to Immigrants from Ghana by Married-couple Households
In terms of married-couple households, the demographic groups most similar to Immigrants from Ghana are Immigrants from Belize (41.8%, a difference of 0.020%), Immigrants from Middle Africa (41.8%, a difference of 0.080%), Arapaho (41.8%, a difference of 0.11%), Immigrants from Bahamas (41.7%, a difference of 0.23%), and Immigrants from Honduras (41.6%, a difference of 0.40%).
| Demographics | Rating | Rank | Married-couple Households |
| Indonesians | 0.0 /100 | #292 | Tragic 42.0% |
| Menominee | 0.0 /100 | #293 | Tragic 42.0% |
| Immigrants | Yemen | 0.0 /100 | #294 | Tragic 42.0% |
| Kiowa | 0.0 /100 | #295 | Tragic 42.0% |
| Immigrants | Sudan | 0.0 /100 | #296 | Tragic 41.9% |
| Arapaho | 0.0 /100 | #297 | Tragic 41.8% |
| Immigrants | Middle Africa | 0.0 /100 | #298 | Tragic 41.8% |
| Immigrants | Ghana | 0.0 /100 | #299 | Tragic 41.8% |
| Immigrants | Belize | 0.0 /100 | #300 | Tragic 41.8% |
| Immigrants | Bahamas | 0.0 /100 | #301 | Tragic 41.7% |
| Immigrants | Honduras | 0.0 /100 | #302 | Tragic 41.6% |
| Sub-Saharan Africans | 0.0 /100 | #303 | Tragic 41.6% |
| Immigrants | Guyana | 0.0 /100 | #304 | Tragic 41.6% |
| Sioux | 0.0 /100 | #305 | Tragic 41.5% |
| Guyanese | 0.0 /100 | #306 | Tragic 41.4% |