Immigrants from Senegal vs Immigrants from Lithuania Married-couple Households
COMPARE
Immigrants from Senegal
Immigrants from Lithuania
Married-couple Households
Married-couple Households Comparison
Immigrants from Senegal
Immigrants from Lithuania
38.4%
MARRIED-COUPLE HOUSEHOLDS
0.0/ 100
METRIC RATING
338th/ 347
METRIC RANK
48.6%
MARRIED-COUPLE HOUSEHOLDS
99.3/ 100
METRIC RATING
54th/ 347
METRIC RANK
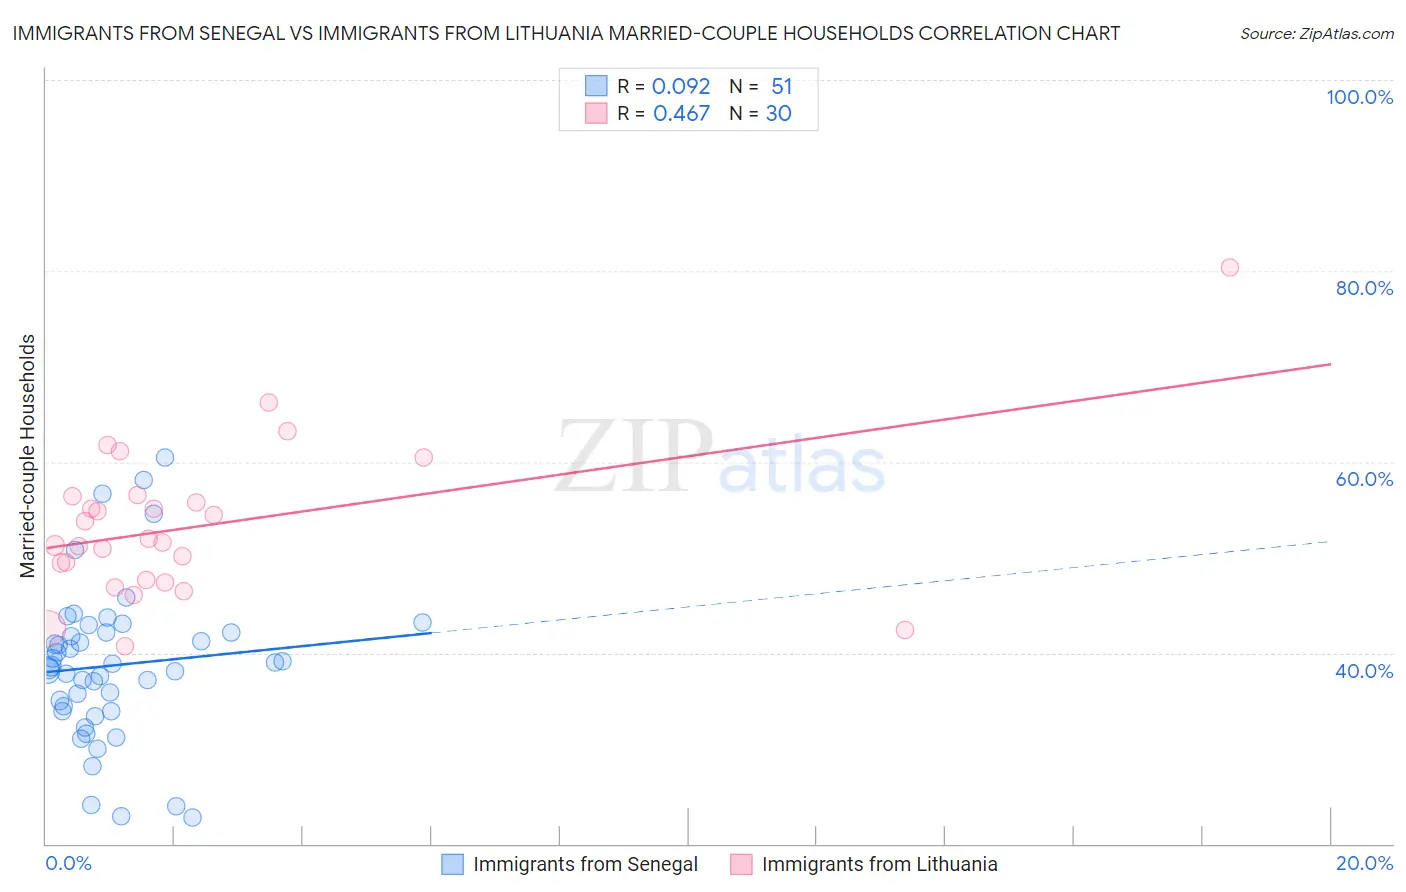
Immigrants from Senegal vs Immigrants from Lithuania Married-couple Households Correlation Chart
The statistical analysis conducted on geographies consisting of 90,124,695 people shows a slight positive correlation between the proportion of Immigrants from Senegal and percentage of married-couple family households in the United States with a correlation coefficient (R) of 0.092 and weighted average of 38.4%. Similarly, the statistical analysis conducted on geographies consisting of 117,713,976 people shows a moderate positive correlation between the proportion of Immigrants from Lithuania and percentage of married-couple family households in the United States with a correlation coefficient (R) of 0.467 and weighted average of 48.6%, a difference of 26.6%.
Married-couple Households Correlation Summary
| Measurement | Immigrants from Senegal | Immigrants from Lithuania |
| Minimum | 22.8% | 40.7% |
| Maximum | 60.5% | 80.4% |
| Range | 37.7% | 39.7% |
| Mean | 38.7% | 53.3% |
| Median | 38.6% | 51.7% |
| Interquartile 25% (IQ1) | 33.9% | 47.6% |
| Interquartile 75% (IQ3) | 42.2% | 56.4% |
| Interquartile Range (IQR) | 8.2% | 8.7% |
| Standard Deviation (Sample) | 8.1% | 8.1% |
| Standard Deviation (Population) | 8.0% | 7.9% |
Similar Demographics by Married-couple Households
Demographics Similar to Immigrants from Senegal by Married-couple Households
In terms of married-couple households, the demographic groups most similar to Immigrants from Senegal are British West Indian (38.3%, a difference of 0.13%), Immigrants from Somalia (38.4%, a difference of 0.16%), Black/African American (38.5%, a difference of 0.30%), Senegalese (38.6%, a difference of 0.48%), and Dominican (38.2%, a difference of 0.50%).
| Demographics | Rating | Rank | Married-couple Households |
| Immigrants | Congo | 0.0 /100 | #331 | Tragic 39.0% |
| Somalis | 0.0 /100 | #332 | Tragic 39.0% |
| Immigrants | West Indies | 0.0 /100 | #333 | Tragic 39.0% |
| Immigrants | St. Vincent and the Grenadines | 0.0 /100 | #334 | Tragic 38.7% |
| Senegalese | 0.0 /100 | #335 | Tragic 38.6% |
| Blacks/African Americans | 0.0 /100 | #336 | Tragic 38.5% |
| Immigrants | Somalia | 0.0 /100 | #337 | Tragic 38.4% |
| Immigrants | Senegal | 0.0 /100 | #338 | Tragic 38.4% |
| British West Indians | 0.0 /100 | #339 | Tragic 38.3% |
| Dominicans | 0.0 /100 | #340 | Tragic 38.2% |
| Cape Verdeans | 0.0 /100 | #341 | Tragic 38.1% |
| Tohono O'odham | 0.0 /100 | #342 | Tragic 37.9% |
| Immigrants | Grenada | 0.0 /100 | #343 | Tragic 37.5% |
| Immigrants | Dominican Republic | 0.0 /100 | #344 | Tragic 37.3% |
| Hopi | 0.0 /100 | #345 | Tragic 36.7% |
Demographics Similar to Immigrants from Lithuania by Married-couple Households
In terms of married-couple households, the demographic groups most similar to Immigrants from Lithuania are White/Caucasian (48.6%, a difference of 0.010%), Austrian (48.6%, a difference of 0.010%), Immigrants from Northern Europe (48.6%, a difference of 0.010%), Irish (48.6%, a difference of 0.060%), and Eastern European (48.6%, a difference of 0.090%).
| Demographics | Rating | Rank | Married-couple Households |
| British | 99.5 /100 | #47 | Exceptional 48.7% |
| Indians (Asian) | 99.4 /100 | #48 | Exceptional 48.7% |
| Immigrants | Sri Lanka | 99.4 /100 | #49 | Exceptional 48.7% |
| Samoans | 99.4 /100 | #50 | Exceptional 48.7% |
| Eastern Europeans | 99.3 /100 | #51 | Exceptional 48.6% |
| Irish | 99.3 /100 | #52 | Exceptional 48.6% |
| Whites/Caucasians | 99.3 /100 | #53 | Exceptional 48.6% |
| Immigrants | Lithuania | 99.3 /100 | #54 | Exceptional 48.6% |
| Austrians | 99.3 /100 | #55 | Exceptional 48.6% |
| Immigrants | Northern Europe | 99.3 /100 | #56 | Exceptional 48.6% |
| Poles | 99.2 /100 | #57 | Exceptional 48.5% |
| Immigrants | Indonesia | 99.2 /100 | #58 | Exceptional 48.5% |
| Czechoslovakians | 99.2 /100 | #59 | Exceptional 48.5% |
| Croatians | 99.1 /100 | #60 | Exceptional 48.5% |
| Bulgarians | 99.1 /100 | #61 | Exceptional 48.5% |