Spaniard vs Panamanian Single Mother Households
COMPARE
Spaniard
Panamanian
Single Mother Households
Single Mother Households Comparison
Spaniards
Panamanians
6.5%
SINGLE MOTHER HOUSEHOLDS
27.8/ 100
METRIC RATING
183rd/ 347
METRIC RANK
7.1%
SINGLE MOTHER HOUSEHOLDS
0.9/ 100
METRIC RATING
238th/ 347
METRIC RANK
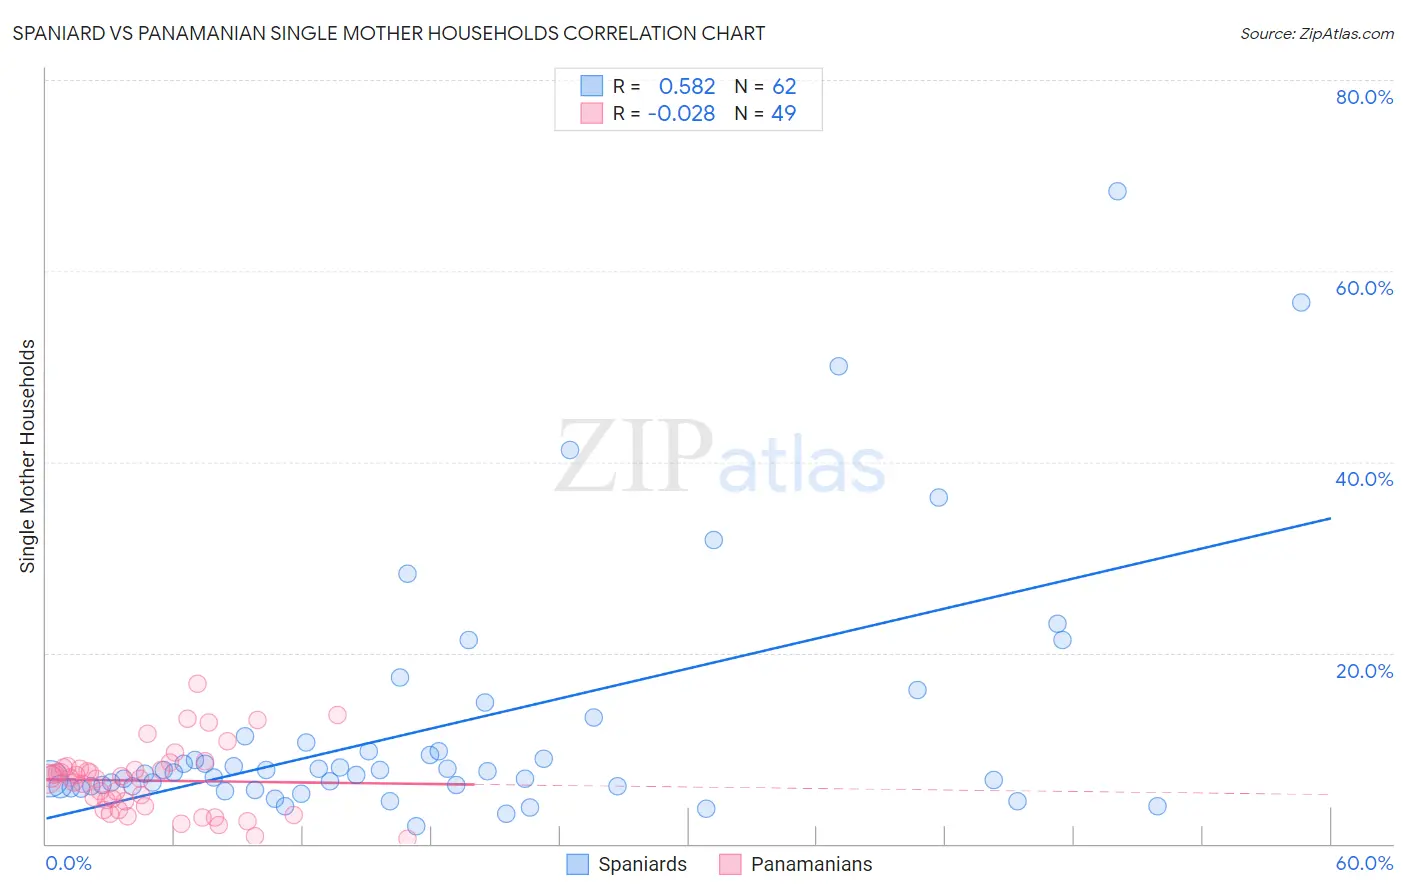
Spaniard vs Panamanian Single Mother Households Correlation Chart
The statistical analysis conducted on geographies consisting of 441,881,486 people shows a substantial positive correlation between the proportion of Spaniards and percentage of single mother households in the United States with a correlation coefficient (R) of 0.582 and weighted average of 6.5%. Similarly, the statistical analysis conducted on geographies consisting of 280,762,519 people shows no correlation between the proportion of Panamanians and percentage of single mother households in the United States with a correlation coefficient (R) of -0.028 and weighted average of 7.1%, a difference of 10.0%.
Single Mother Households Correlation Summary
| Measurement | Spaniard | Panamanian |
| Minimum | 1.9% | 0.51% |
| Maximum | 68.3% | 16.7% |
| Range | 66.4% | 16.2% |
| Mean | 12.3% | 6.6% |
| Median | 7.5% | 6.9% |
| Interquartile 25% (IQ1) | 6.0% | 3.7% |
| Interquartile 75% (IQ3) | 10.6% | 7.9% |
| Interquartile Range (IQR) | 4.7% | 4.2% |
| Standard Deviation (Sample) | 13.2% | 3.5% |
| Standard Deviation (Population) | 13.1% | 3.5% |
Similar Demographics by Single Mother Households
Demographics Similar to Spaniards by Single Mother Households
In terms of single mother households, the demographic groups most similar to Spaniards are Ethiopian (6.5%, a difference of 0.24%), Ugandan (6.5%, a difference of 0.30%), Costa Rican (6.5%, a difference of 0.42%), Immigrants from Afghanistan (6.5%, a difference of 0.43%), and Ottawa (6.5%, a difference of 0.56%).
| Demographics | Rating | Rank | Single Mother Households |
| Immigrants | Bosnia and Herzegovina | 44.3 /100 | #176 | Average 6.3% |
| Osage | 43.0 /100 | #177 | Average 6.4% |
| Portuguese | 40.0 /100 | #178 | Fair 6.4% |
| Hmong | 39.8 /100 | #179 | Fair 6.4% |
| Immigrants | Nepal | 36.1 /100 | #180 | Fair 6.4% |
| Spanish | 33.4 /100 | #181 | Fair 6.4% |
| South American Indians | 33.4 /100 | #182 | Fair 6.4% |
| Spaniards | 27.8 /100 | #183 | Fair 6.5% |
| Ethiopians | 26.0 /100 | #184 | Fair 6.5% |
| Ugandans | 25.6 /100 | #185 | Fair 6.5% |
| Costa Ricans | 24.8 /100 | #186 | Fair 6.5% |
| Immigrants | Afghanistan | 24.7 /100 | #187 | Fair 6.5% |
| Ottawa | 23.8 /100 | #188 | Fair 6.5% |
| Delaware | 23.3 /100 | #189 | Fair 6.5% |
| Peruvians | 21.6 /100 | #190 | Fair 6.5% |
Demographics Similar to Panamanians by Single Mother Households
In terms of single mother households, the demographic groups most similar to Panamanians are Arapaho (7.1%, a difference of 0.14%), Ute (7.1%, a difference of 0.23%), Kiowa (7.1%, a difference of 0.27%), Immigrants from Panama (7.2%, a difference of 0.59%), and Immigrants from Portugal (7.2%, a difference of 0.94%).
| Demographics | Rating | Rank | Single Mother Households |
| Spanish Americans | 1.6 /100 | #231 | Tragic 7.0% |
| Comanche | 1.5 /100 | #232 | Tragic 7.0% |
| Choctaw | 1.4 /100 | #233 | Tragic 7.0% |
| Chickasaw | 1.4 /100 | #234 | Tragic 7.0% |
| Immigrants | Burma/Myanmar | 1.4 /100 | #235 | Tragic 7.0% |
| Ute | 1.0 /100 | #236 | Tragic 7.1% |
| Arapaho | 1.0 /100 | #237 | Tragic 7.1% |
| Panamanians | 0.9 /100 | #238 | Tragic 7.1% |
| Kiowa | 0.8 /100 | #239 | Tragic 7.1% |
| Immigrants | Panama | 0.7 /100 | #240 | Tragic 7.2% |
| Immigrants | Portugal | 0.6 /100 | #241 | Tragic 7.2% |
| Fijians | 0.6 /100 | #242 | Tragic 7.2% |
| Ecuadorians | 0.6 /100 | #243 | Tragic 7.2% |
| Cubans | 0.6 /100 | #244 | Tragic 7.2% |
| Immigrants | Cambodia | 0.5 /100 | #245 | Tragic 7.2% |