Spaniard vs Paiute Single Mother Households
COMPARE
Spaniard
Paiute
Single Mother Households
Single Mother Households Comparison
Spaniards
Paiute
6.5%
SINGLE MOTHER HOUSEHOLDS
27.8/ 100
METRIC RATING
183rd/ 347
METRIC RANK
7.0%
SINGLE MOTHER HOUSEHOLDS
2.4/ 100
METRIC RATING
226th/ 347
METRIC RANK
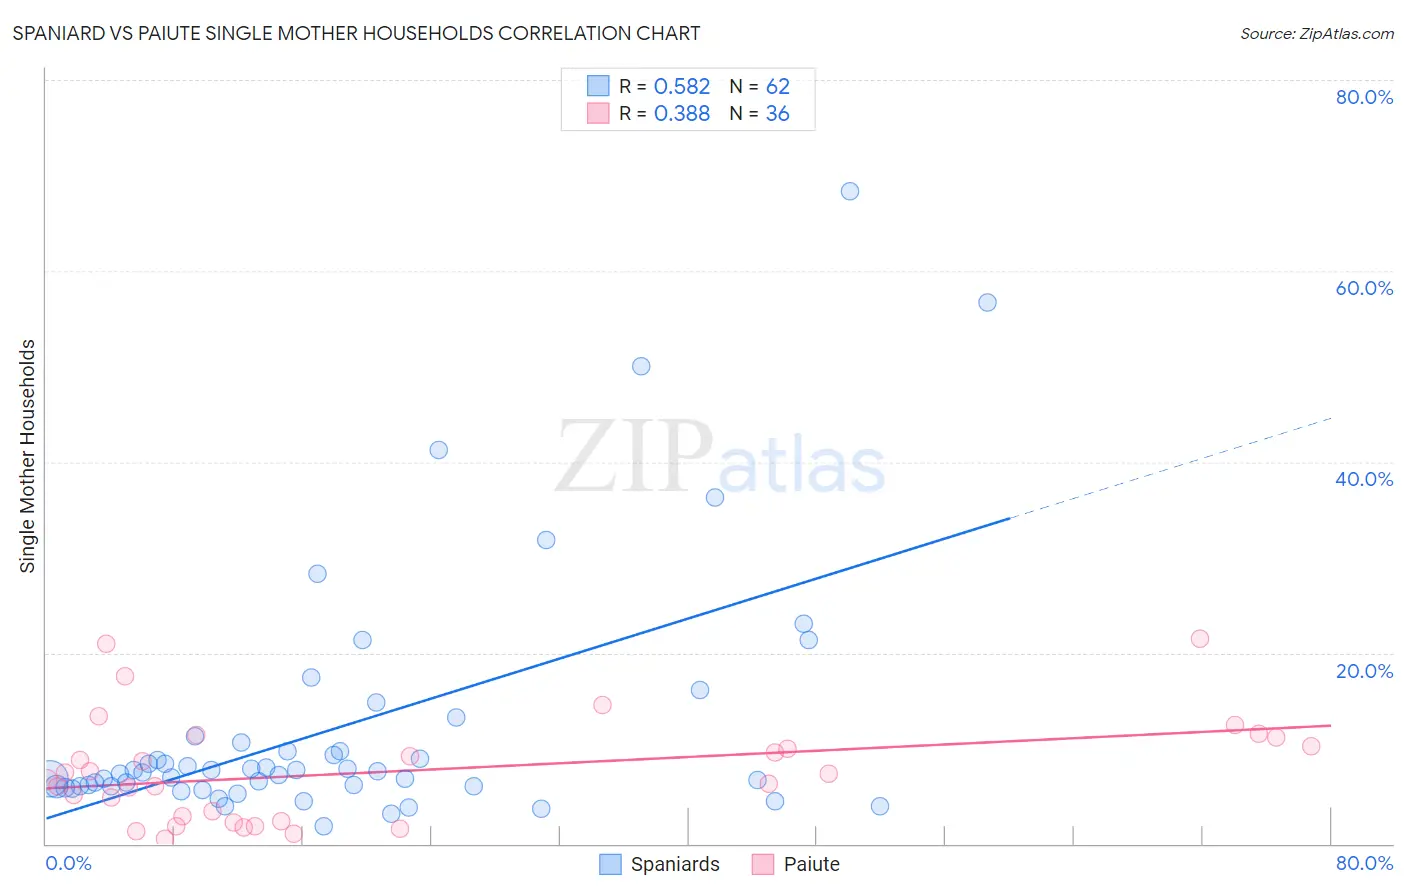
Spaniard vs Paiute Single Mother Households Correlation Chart
The statistical analysis conducted on geographies consisting of 441,881,486 people shows a substantial positive correlation between the proportion of Spaniards and percentage of single mother households in the United States with a correlation coefficient (R) of 0.582 and weighted average of 6.5%. Similarly, the statistical analysis conducted on geographies consisting of 58,356,000 people shows a mild positive correlation between the proportion of Paiute and percentage of single mother households in the United States with a correlation coefficient (R) of 0.388 and weighted average of 7.0%, a difference of 7.3%.
Single Mother Households Correlation Summary
| Measurement | Spaniard | Paiute |
| Minimum | 1.9% | 0.59% |
| Maximum | 68.3% | 21.4% |
| Range | 66.4% | 20.8% |
| Mean | 12.3% | 7.6% |
| Median | 7.5% | 7.0% |
| Interquartile 25% (IQ1) | 6.0% | 2.6% |
| Interquartile 75% (IQ3) | 10.6% | 10.7% |
| Interquartile Range (IQR) | 4.7% | 8.0% |
| Standard Deviation (Sample) | 13.2% | 5.4% |
| Standard Deviation (Population) | 13.1% | 5.3% |
Similar Demographics by Single Mother Households
Demographics Similar to Spaniards by Single Mother Households
In terms of single mother households, the demographic groups most similar to Spaniards are Ethiopian (6.5%, a difference of 0.24%), Ugandan (6.5%, a difference of 0.30%), Costa Rican (6.5%, a difference of 0.42%), Immigrants from Afghanistan (6.5%, a difference of 0.43%), and Ottawa (6.5%, a difference of 0.56%).
| Demographics | Rating | Rank | Single Mother Households |
| Immigrants | Bosnia and Herzegovina | 44.3 /100 | #176 | Average 6.3% |
| Osage | 43.0 /100 | #177 | Average 6.4% |
| Portuguese | 40.0 /100 | #178 | Fair 6.4% |
| Hmong | 39.8 /100 | #179 | Fair 6.4% |
| Immigrants | Nepal | 36.1 /100 | #180 | Fair 6.4% |
| Spanish | 33.4 /100 | #181 | Fair 6.4% |
| South American Indians | 33.4 /100 | #182 | Fair 6.4% |
| Spaniards | 27.8 /100 | #183 | Fair 6.5% |
| Ethiopians | 26.0 /100 | #184 | Fair 6.5% |
| Ugandans | 25.6 /100 | #185 | Fair 6.5% |
| Costa Ricans | 24.8 /100 | #186 | Fair 6.5% |
| Immigrants | Afghanistan | 24.7 /100 | #187 | Fair 6.5% |
| Ottawa | 23.8 /100 | #188 | Fair 6.5% |
| Delaware | 23.3 /100 | #189 | Fair 6.5% |
| Peruvians | 21.6 /100 | #190 | Fair 6.5% |
Demographics Similar to Paiute by Single Mother Households
In terms of single mother households, the demographic groups most similar to Paiute are Kenyan (7.0%, a difference of 0.14%), Iroquois (7.0%, a difference of 0.17%), Immigrants from Kenya (7.0%, a difference of 0.34%), Sudanese (6.9%, a difference of 0.68%), and Immigrants from Sudan (6.9%, a difference of 0.96%).
| Demographics | Rating | Rank | Single Mother Households |
| Immigrants | Immigrants | 4.3 /100 | #219 | Tragic 6.8% |
| Immigrants | Thailand | 4.0 /100 | #220 | Tragic 6.9% |
| French American Indians | 3.7 /100 | #221 | Tragic 6.9% |
| Immigrants | Bangladesh | 3.7 /100 | #222 | Tragic 6.9% |
| Immigrants | Micronesia | 3.6 /100 | #223 | Tragic 6.9% |
| Immigrants | Sudan | 3.5 /100 | #224 | Tragic 6.9% |
| Sudanese | 3.1 /100 | #225 | Tragic 6.9% |
| Paiute | 2.4 /100 | #226 | Tragic 7.0% |
| Kenyans | 2.3 /100 | #227 | Tragic 7.0% |
| Iroquois | 2.2 /100 | #228 | Tragic 7.0% |
| Immigrants | Kenya | 2.1 /100 | #229 | Tragic 7.0% |
| Creek | 1.6 /100 | #230 | Tragic 7.0% |
| Spanish Americans | 1.6 /100 | #231 | Tragic 7.0% |
| Comanche | 1.5 /100 | #232 | Tragic 7.0% |
| Choctaw | 1.4 /100 | #233 | Tragic 7.0% |