Spaniard vs Albanian Single Mother Households
COMPARE
Spaniard
Albanian
Single Mother Households
Single Mother Households Comparison
Spaniards
Albanians
6.5%
SINGLE MOTHER HOUSEHOLDS
27.8/ 100
METRIC RATING
183rd/ 347
METRIC RANK
5.9%
SINGLE MOTHER HOUSEHOLDS
91.1/ 100
METRIC RATING
132nd/ 347
METRIC RANK
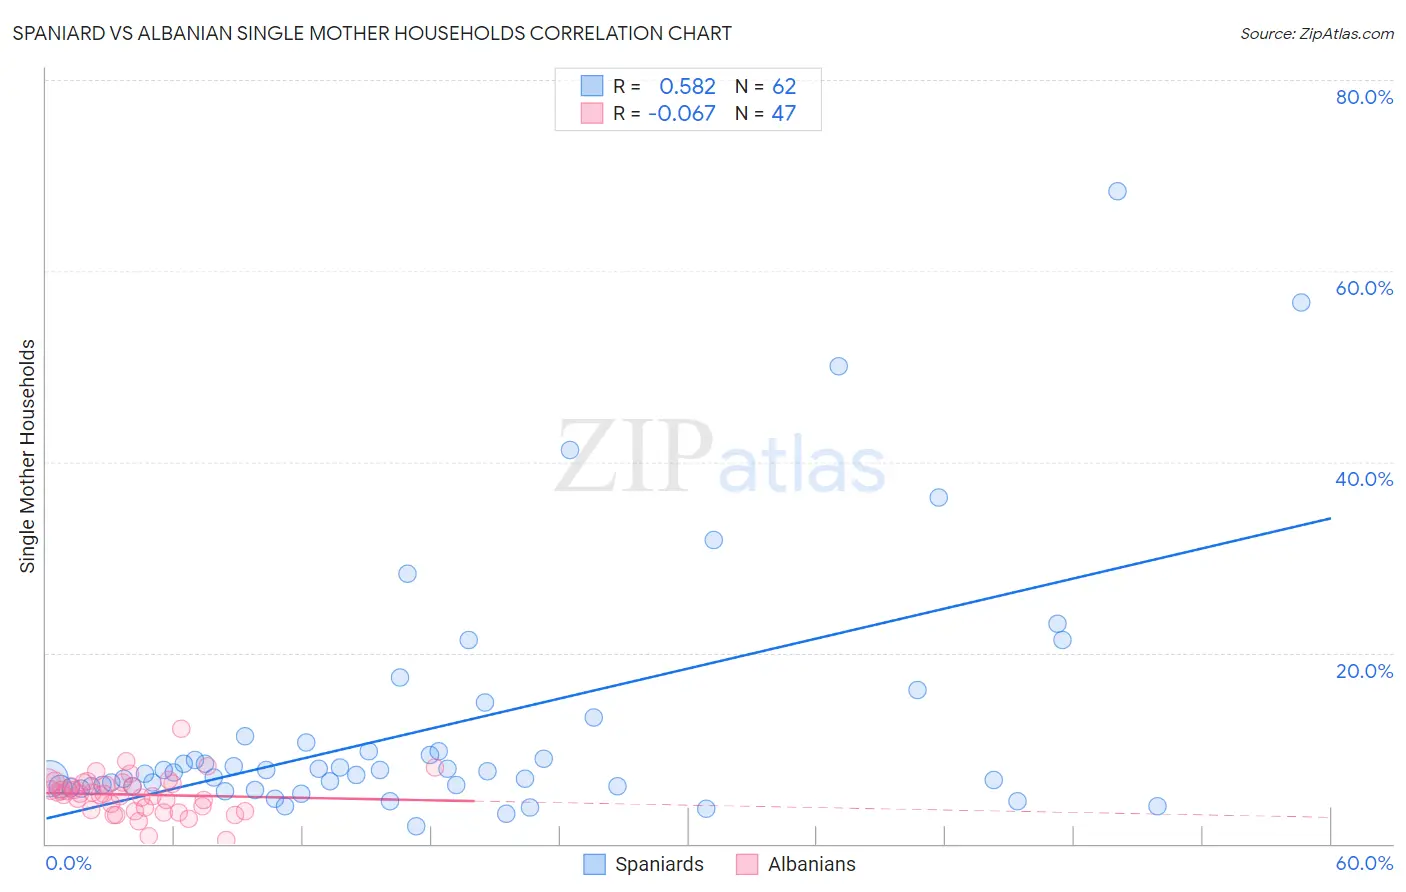
Spaniard vs Albanian Single Mother Households Correlation Chart
The statistical analysis conducted on geographies consisting of 441,881,486 people shows a substantial positive correlation between the proportion of Spaniards and percentage of single mother households in the United States with a correlation coefficient (R) of 0.582 and weighted average of 6.5%. Similarly, the statistical analysis conducted on geographies consisting of 193,011,993 people shows a slight negative correlation between the proportion of Albanians and percentage of single mother households in the United States with a correlation coefficient (R) of -0.067 and weighted average of 5.9%, a difference of 9.6%.
Single Mother Households Correlation Summary
| Measurement | Spaniard | Albanian |
| Minimum | 1.9% | 0.45% |
| Maximum | 68.3% | 12.0% |
| Range | 66.4% | 11.6% |
| Mean | 12.3% | 5.1% |
| Median | 7.5% | 5.2% |
| Interquartile 25% (IQ1) | 6.0% | 3.5% |
| Interquartile 75% (IQ3) | 10.6% | 6.4% |
| Interquartile Range (IQR) | 4.7% | 2.9% |
| Standard Deviation (Sample) | 13.2% | 2.1% |
| Standard Deviation (Population) | 13.1% | 2.0% |
Similar Demographics by Single Mother Households
Demographics Similar to Spaniards by Single Mother Households
In terms of single mother households, the demographic groups most similar to Spaniards are Ethiopian (6.5%, a difference of 0.24%), Ugandan (6.5%, a difference of 0.30%), Costa Rican (6.5%, a difference of 0.42%), Immigrants from Afghanistan (6.5%, a difference of 0.43%), and Ottawa (6.5%, a difference of 0.56%).
| Demographics | Rating | Rank | Single Mother Households |
| Immigrants | Bosnia and Herzegovina | 44.3 /100 | #176 | Average 6.3% |
| Osage | 43.0 /100 | #177 | Average 6.4% |
| Portuguese | 40.0 /100 | #178 | Fair 6.4% |
| Hmong | 39.8 /100 | #179 | Fair 6.4% |
| Immigrants | Nepal | 36.1 /100 | #180 | Fair 6.4% |
| Spanish | 33.4 /100 | #181 | Fair 6.4% |
| South American Indians | 33.4 /100 | #182 | Fair 6.4% |
| Spaniards | 27.8 /100 | #183 | Fair 6.5% |
| Ethiopians | 26.0 /100 | #184 | Fair 6.5% |
| Ugandans | 25.6 /100 | #185 | Fair 6.5% |
| Costa Ricans | 24.8 /100 | #186 | Fair 6.5% |
| Immigrants | Afghanistan | 24.7 /100 | #187 | Fair 6.5% |
| Ottawa | 23.8 /100 | #188 | Fair 6.5% |
| Delaware | 23.3 /100 | #189 | Fair 6.5% |
| Peruvians | 21.6 /100 | #190 | Fair 6.5% |
Demographics Similar to Albanians by Single Mother Households
In terms of single mother households, the demographic groups most similar to Albanians are Immigrants from Spain (5.9%, a difference of 0.040%), Egyptian (5.9%, a difference of 0.15%), Canadian (5.9%, a difference of 0.22%), Immigrants from Saudi Arabia (5.9%, a difference of 0.31%), and Palestinian (5.9%, a difference of 0.39%).
| Demographics | Rating | Rank | Single Mother Households |
| Slavs | 92.9 /100 | #125 | Exceptional 5.9% |
| Welsh | 92.8 /100 | #126 | Exceptional 5.9% |
| Lebanese | 92.4 /100 | #127 | Exceptional 5.9% |
| Czechoslovakians | 92.2 /100 | #128 | Exceptional 5.9% |
| Immigrants | Bolivia | 92.2 /100 | #129 | Exceptional 5.9% |
| Palestinians | 92.1 /100 | #130 | Exceptional 5.9% |
| Immigrants | Spain | 91.2 /100 | #131 | Exceptional 5.9% |
| Albanians | 91.1 /100 | #132 | Exceptional 5.9% |
| Egyptians | 90.7 /100 | #133 | Exceptional 5.9% |
| Canadians | 90.5 /100 | #134 | Exceptional 5.9% |
| Immigrants | Saudi Arabia | 90.2 /100 | #135 | Exceptional 5.9% |
| Jordanians | 88.9 /100 | #136 | Excellent 6.0% |
| Immigrants | Pakistan | 88.4 /100 | #137 | Excellent 6.0% |
| Icelanders | 86.9 /100 | #138 | Excellent 6.0% |
| Syrians | 86.0 /100 | #139 | Excellent 6.0% |