Spaniard vs Immigrants from Laos Divorced or Separated
COMPARE
Spaniard
Immigrants from Laos
Divorced or Separated
Divorced or Separated Comparison
Spaniards
Immigrants from Laos
12.7%
DIVORCED OR SEPARATED
0.2/ 100
METRIC RATING
276th/ 347
METRIC RANK
12.4%
DIVORCED OR SEPARATED
4.2/ 100
METRIC RATING
237th/ 347
METRIC RANK
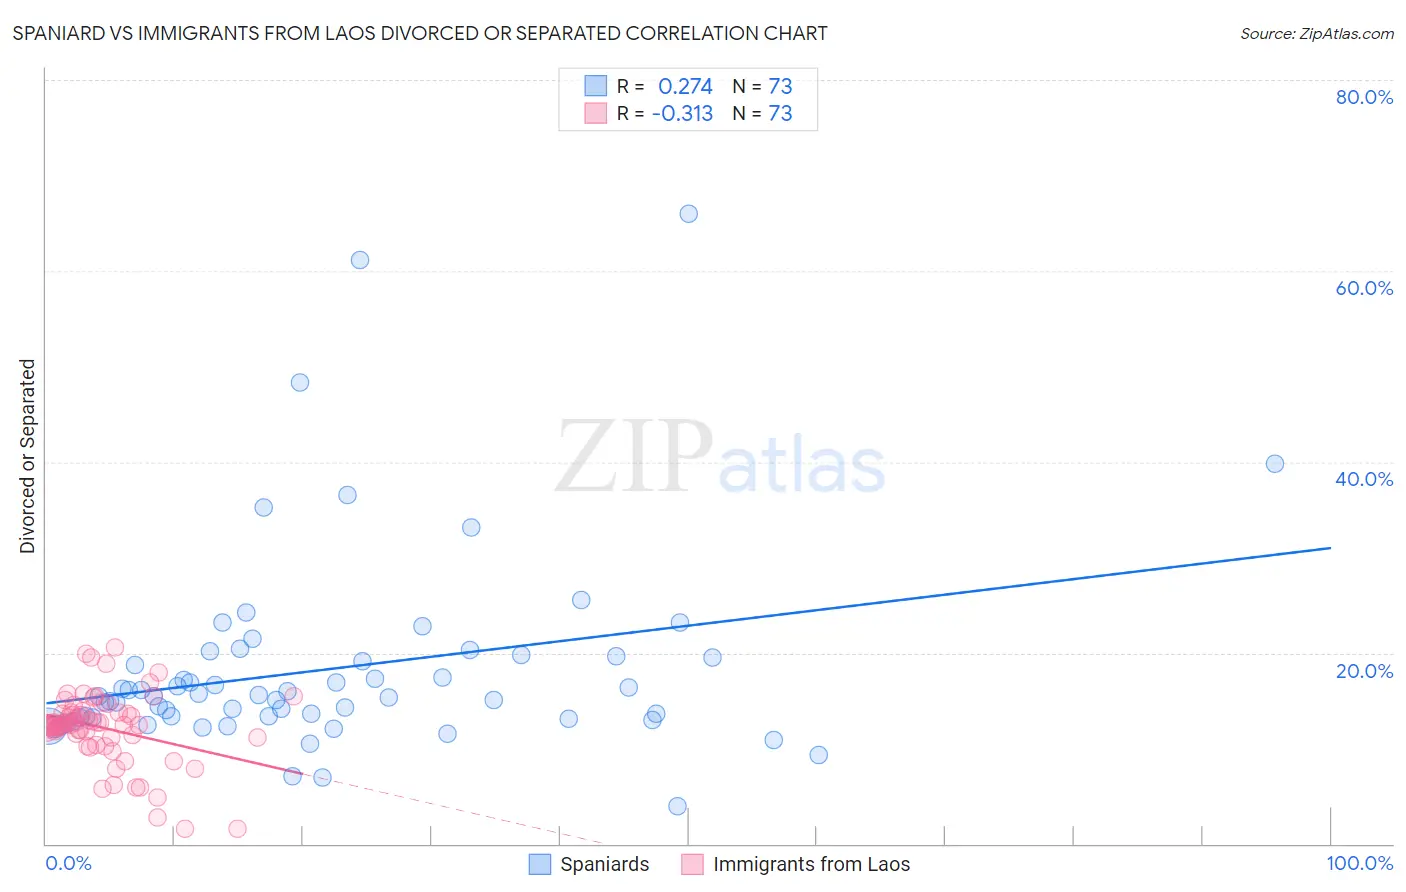
Spaniard vs Immigrants from Laos Divorced or Separated Correlation Chart
The statistical analysis conducted on geographies consisting of 443,302,888 people shows a weak positive correlation between the proportion of Spaniards and percentage of population currently divorced or separated in the United States with a correlation coefficient (R) of 0.274 and weighted average of 12.7%. Similarly, the statistical analysis conducted on geographies consisting of 201,474,624 people shows a mild negative correlation between the proportion of Immigrants from Laos and percentage of population currently divorced or separated in the United States with a correlation coefficient (R) of -0.313 and weighted average of 12.4%, a difference of 2.4%.
Divorced or Separated Correlation Summary
| Measurement | Spaniard | Immigrants from Laos |
| Minimum | 3.9% | 1.6% |
| Maximum | 66.0% | 20.6% |
| Range | 62.1% | 19.0% |
| Mean | 18.3% | 12.1% |
| Median | 15.4% | 12.5% |
| Interquartile 25% (IQ1) | 13.2% | 11.1% |
| Interquartile 75% (IQ3) | 19.5% | 13.7% |
| Interquartile Range (IQR) | 6.3% | 2.6% |
| Standard Deviation (Sample) | 10.5% | 3.8% |
| Standard Deviation (Population) | 10.4% | 3.7% |
Similar Demographics by Divorced or Separated
Demographics Similar to Spaniards by Divorced or Separated
In terms of divorced or separated, the demographic groups most similar to Spaniards are Dominican (12.7%, a difference of 0.050%), Central American Indian (12.7%, a difference of 0.060%), Bermudan (12.7%, a difference of 0.090%), Immigrants from Micronesia (12.7%, a difference of 0.10%), and Lumbee (12.7%, a difference of 0.21%).
| Demographics | Rating | Rank | Divorced or Separated |
| Immigrants | Liberia | 0.4 /100 | #269 | Tragic 12.6% |
| Ute | 0.4 /100 | #270 | Tragic 12.6% |
| Panamanians | 0.3 /100 | #271 | Tragic 12.7% |
| Immigrants | Middle Africa | 0.3 /100 | #272 | Tragic 12.7% |
| Immigrants | Micronesia | 0.3 /100 | #273 | Tragic 12.7% |
| Bermudans | 0.3 /100 | #274 | Tragic 12.7% |
| Central American Indians | 0.3 /100 | #275 | Tragic 12.7% |
| Spaniards | 0.2 /100 | #276 | Tragic 12.7% |
| Dominicans | 0.2 /100 | #277 | Tragic 12.7% |
| Lumbee | 0.2 /100 | #278 | Tragic 12.7% |
| Immigrants | Dominican Republic | 0.2 /100 | #279 | Tragic 12.7% |
| Immigrants | Zaire | 0.2 /100 | #280 | Tragic 12.7% |
| Pueblo | 0.2 /100 | #281 | Tragic 12.7% |
| Sub-Saharan Africans | 0.1 /100 | #282 | Tragic 12.7% |
| Delaware | 0.1 /100 | #283 | Tragic 12.7% |
Demographics Similar to Immigrants from Laos by Divorced or Separated
In terms of divorced or separated, the demographic groups most similar to Immigrants from Laos are Colombian (12.4%, a difference of 0.0%), Immigrants from Bosnia and Herzegovina (12.4%, a difference of 0.030%), Sudanese (12.4%, a difference of 0.030%), Immigrants from Germany (12.4%, a difference of 0.040%), and West Indian (12.4%, a difference of 0.050%).
| Demographics | Rating | Rank | Divorced or Separated |
| Yakama | 7.8 /100 | #230 | Tragic 12.3% |
| Yugoslavians | 6.6 /100 | #231 | Tragic 12.3% |
| Canadians | 5.3 /100 | #232 | Tragic 12.4% |
| Malaysians | 4.8 /100 | #233 | Tragic 12.4% |
| West Indians | 4.4 /100 | #234 | Tragic 12.4% |
| Immigrants | Bosnia and Herzegovina | 4.3 /100 | #235 | Tragic 12.4% |
| Colombians | 4.2 /100 | #236 | Tragic 12.4% |
| Immigrants | Laos | 4.2 /100 | #237 | Tragic 12.4% |
| Sudanese | 4.0 /100 | #238 | Tragic 12.4% |
| Immigrants | Germany | 4.0 /100 | #239 | Tragic 12.4% |
| British West Indians | 3.7 /100 | #240 | Tragic 12.4% |
| Uruguayans | 3.4 /100 | #241 | Tragic 12.4% |
| Dutch | 3.1 /100 | #242 | Tragic 12.4% |
| Immigrants | Latin America | 2.8 /100 | #243 | Tragic 12.4% |
| Alaska Natives | 2.5 /100 | #244 | Tragic 12.4% |