Spaniard vs Immigrants from Latin America Divorced or Separated
COMPARE
Spaniard
Immigrants from Latin America
Divorced or Separated
Divorced or Separated Comparison
Spaniards
Immigrants from Latin America
12.7%
DIVORCED OR SEPARATED
0.2/ 100
METRIC RATING
276th/ 347
METRIC RANK
12.4%
DIVORCED OR SEPARATED
2.8/ 100
METRIC RATING
243rd/ 347
METRIC RANK
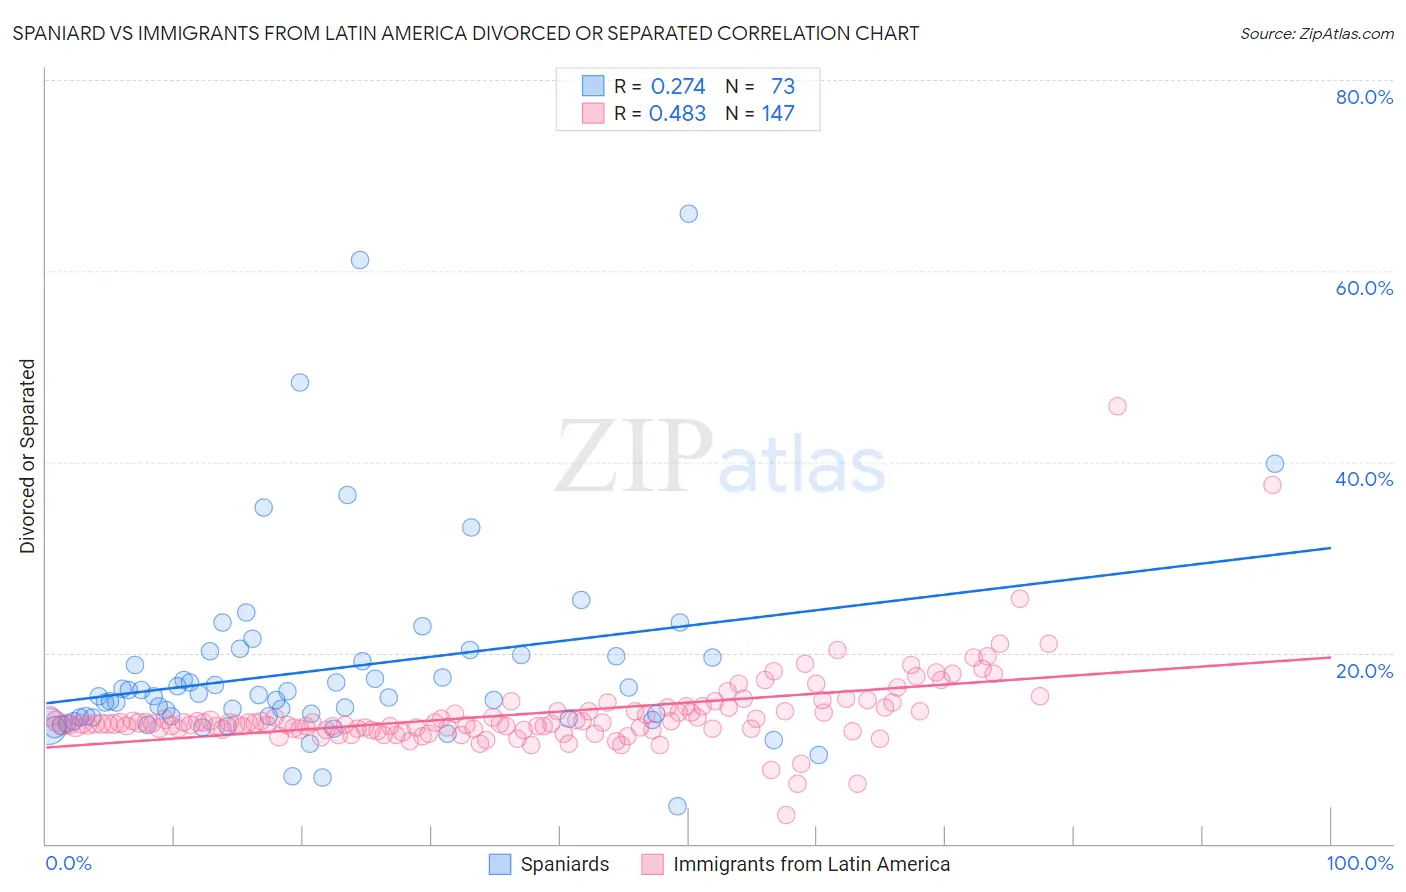
Spaniard vs Immigrants from Latin America Divorced or Separated Correlation Chart
The statistical analysis conducted on geographies consisting of 443,302,888 people shows a weak positive correlation between the proportion of Spaniards and percentage of population currently divorced or separated in the United States with a correlation coefficient (R) of 0.274 and weighted average of 12.7%. Similarly, the statistical analysis conducted on geographies consisting of 558,222,982 people shows a moderate positive correlation between the proportion of Immigrants from Latin America and percentage of population currently divorced or separated in the United States with a correlation coefficient (R) of 0.483 and weighted average of 12.4%, a difference of 2.1%.
Divorced or Separated Correlation Summary
| Measurement | Spaniard | Immigrants from Latin America |
| Minimum | 3.9% | 3.0% |
| Maximum | 66.0% | 45.8% |
| Range | 62.1% | 42.8% |
| Mean | 18.3% | 13.6% |
| Median | 15.4% | 12.6% |
| Interquartile 25% (IQ1) | 13.2% | 12.0% |
| Interquartile 75% (IQ3) | 19.5% | 13.9% |
| Interquartile Range (IQR) | 6.3% | 1.9% |
| Standard Deviation (Sample) | 10.5% | 4.3% |
| Standard Deviation (Population) | 10.4% | 4.3% |
Similar Demographics by Divorced or Separated
Demographics Similar to Spaniards by Divorced or Separated
In terms of divorced or separated, the demographic groups most similar to Spaniards are Dominican (12.7%, a difference of 0.050%), Central American Indian (12.7%, a difference of 0.060%), Bermudan (12.7%, a difference of 0.090%), Immigrants from Micronesia (12.7%, a difference of 0.10%), and Lumbee (12.7%, a difference of 0.21%).
| Demographics | Rating | Rank | Divorced or Separated |
| Immigrants | Liberia | 0.4 /100 | #269 | Tragic 12.6% |
| Ute | 0.4 /100 | #270 | Tragic 12.6% |
| Panamanians | 0.3 /100 | #271 | Tragic 12.7% |
| Immigrants | Middle Africa | 0.3 /100 | #272 | Tragic 12.7% |
| Immigrants | Micronesia | 0.3 /100 | #273 | Tragic 12.7% |
| Bermudans | 0.3 /100 | #274 | Tragic 12.7% |
| Central American Indians | 0.3 /100 | #275 | Tragic 12.7% |
| Spaniards | 0.2 /100 | #276 | Tragic 12.7% |
| Dominicans | 0.2 /100 | #277 | Tragic 12.7% |
| Lumbee | 0.2 /100 | #278 | Tragic 12.7% |
| Immigrants | Dominican Republic | 0.2 /100 | #279 | Tragic 12.7% |
| Immigrants | Zaire | 0.2 /100 | #280 | Tragic 12.7% |
| Pueblo | 0.2 /100 | #281 | Tragic 12.7% |
| Sub-Saharan Africans | 0.1 /100 | #282 | Tragic 12.7% |
| Delaware | 0.1 /100 | #283 | Tragic 12.7% |
Demographics Similar to Immigrants from Latin America by Divorced or Separated
In terms of divorced or separated, the demographic groups most similar to Immigrants from Latin America are Dutch (12.4%, a difference of 0.070%), Alaska Native (12.4%, a difference of 0.10%), Uruguayan (12.4%, a difference of 0.15%), British West Indian (12.4%, a difference of 0.24%), and Immigrants from Germany (12.4%, a difference of 0.29%).
| Demographics | Rating | Rank | Divorced or Separated |
| Colombians | 4.2 /100 | #236 | Tragic 12.4% |
| Immigrants | Laos | 4.2 /100 | #237 | Tragic 12.4% |
| Sudanese | 4.0 /100 | #238 | Tragic 12.4% |
| Immigrants | Germany | 4.0 /100 | #239 | Tragic 12.4% |
| British West Indians | 3.7 /100 | #240 | Tragic 12.4% |
| Uruguayans | 3.4 /100 | #241 | Tragic 12.4% |
| Dutch | 3.1 /100 | #242 | Tragic 12.4% |
| Immigrants | Latin America | 2.8 /100 | #243 | Tragic 12.4% |
| Alaska Natives | 2.5 /100 | #244 | Tragic 12.4% |
| Hispanics or Latinos | 2.0 /100 | #245 | Tragic 12.5% |
| Immigrants | West Indies | 1.9 /100 | #246 | Tragic 12.5% |
| Germans | 1.8 /100 | #247 | Tragic 12.5% |
| Nepalese | 1.8 /100 | #248 | Tragic 12.5% |
| Finns | 1.8 /100 | #249 | Tragic 12.5% |
| Irish | 1.3 /100 | #250 | Tragic 12.5% |